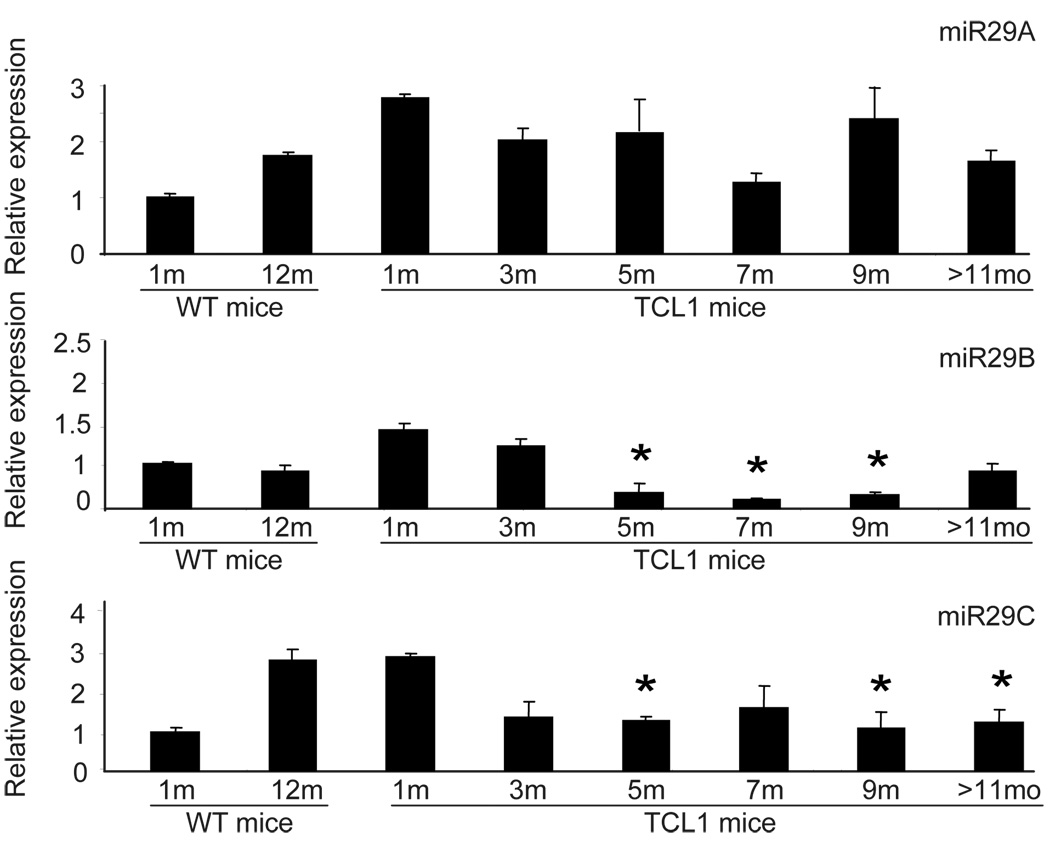
Figure 2. Decreased miR29s and increased DNMTs in Eµ-TCL1 mice.
Expression of miR29s by TaqMan PCR was done on TCL1 mouse spleen B cells. Each bar represents the average results from three mice at the indicated age. Results were normalized by the data obtained from untransformed B cells from 1 month old mice. Standard deviation was calculated by using mean ± SEM of respective data. Two tail unequal variant student T test was applied, star represents significant results with P value less than 0.05.

