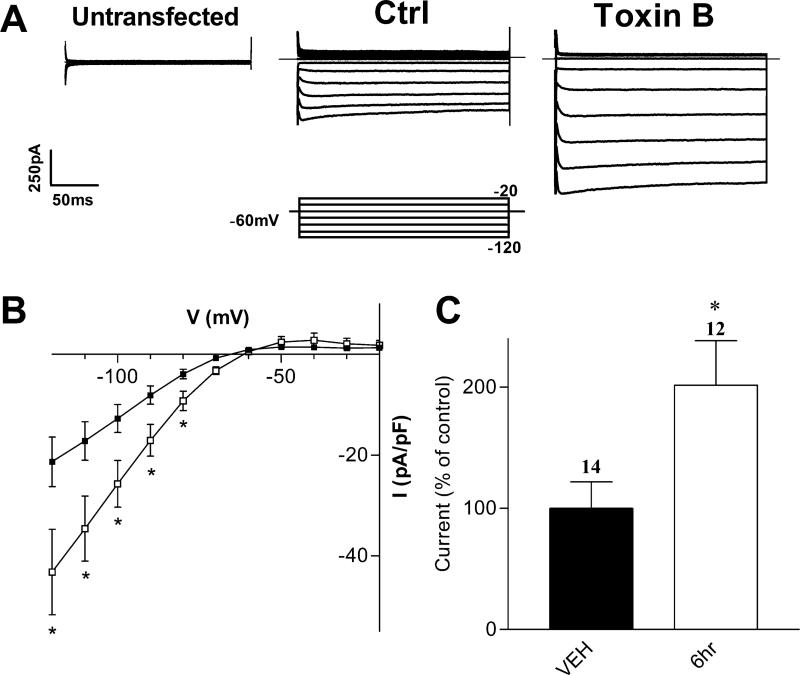
FIGURE 1. Inhibiting Rho Family GTPases Increases Kir2.1 Macroscopic Current Density.
A) Representative current traces from tsA201 cells co-transfected with Kir2.1 cDNA and β-gal under control conditions or after pre-incubation with 100 pg/mL C. difficile toxin B. Superimposed current traces are shown for 200 ms voltage steps from -120 to -20 mV in 10 mV increments from a holding potential of -60 mV. Inset shows the voltage protocol used. B) Current-voltage (I-V) relationship of control cells (vehicle, filled squares) and cells incubated with toxin B for 6 hours (open squares). The currents are presented as pA/pF to compensate for potential cell size differences. C) Normalized current densities at –100 mV, presented as percent of control currents. Currents were normalized to the mean of control cells by day of recording. Numbers above columns indicate number of cells in each condition. Asterisks denote statistically significantly different from control cells, using non-parametric t-test (p < 0.05).

