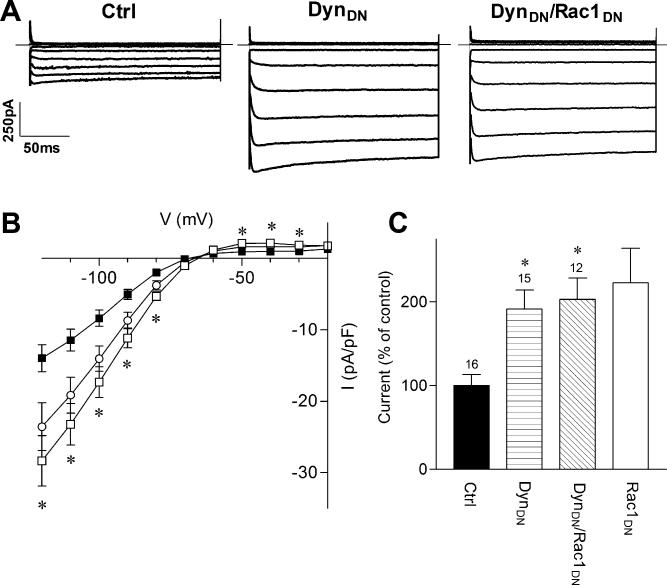
FIGURE 4. Dominant-Negative Dynamin Mimics and Occludes the Effect of Rac1DN on Kir2.1.
A) Representative current traces from cells transfected with Kir2.1 cDNA and either a control plasmid (Ctrl), dominant-negative dynamin (DynDN) or both DynDN and Rac1DN cDNAs. Superimposed current traces are shown for 200 ms voltage steps from -120 to -20 mV in 10 mV increments from a holding potential of -60 mV. Scale bars: 50 ms and 250 pA. B) Current-voltage relationship for control (filled squares), DynDN (open squares) and DynDN/Rac1DN (open circles) transfected cells. C) Normalized current densities measured in control, DynDN, and DynDN/Rac1DN transfected cells at –100 mV. Rac1DN transfected cells from Fig. 2 are also included for comparison. Numbers above columns indicate number of cells in each condition. Asterisks denote statistically significantly different from control cells (p < 0.05), using a non-parametric Kruskil-Wallis ANOVA, followed by Dunn's multiple comparison post hoc test.

