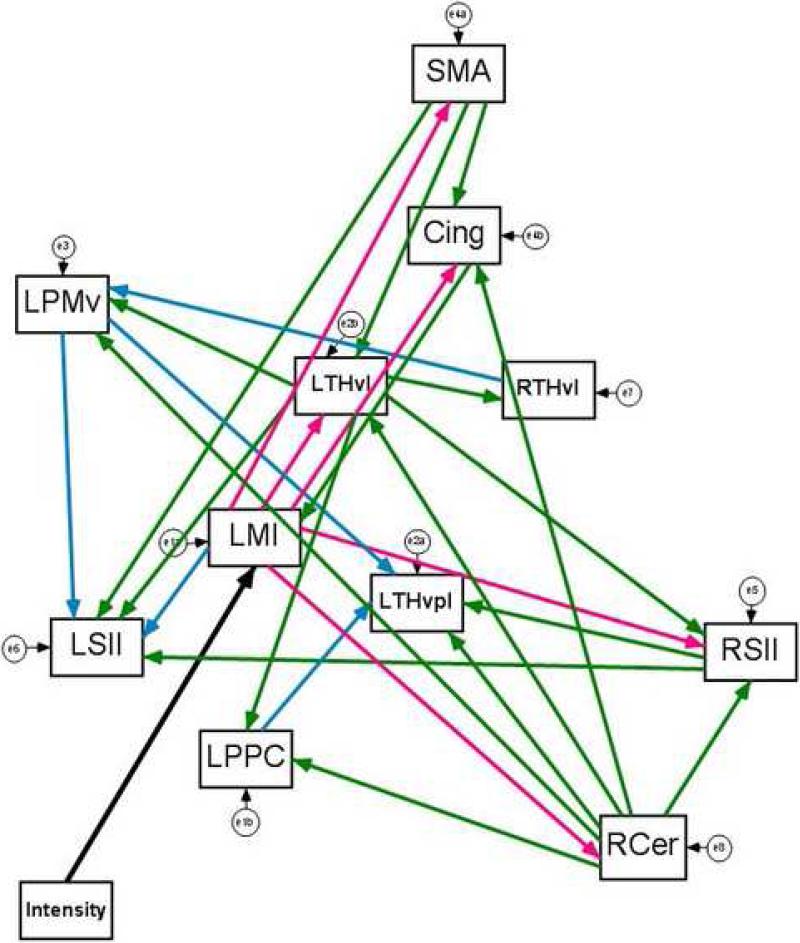
Figure 4. Final Model of LMIhand Connectivity.
Exploratory analysis of 11 TMS ROIs using SEM revealed a complex network of LMIhand connectivity that fit the data extremely well (χ2 = 22.150, df = 38, P = 0.981, CFI = 1.0, TLI = 1.0, RMSEA = 0.000, 90% CIRMSEA = 0.000-0.000). Red paths = first-level paths from LM1; green paths = second-level paths; blue paths = third-level paths. Error terms are represented by the circular variables.

