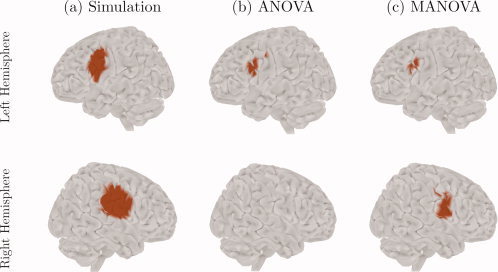
Figure 1.

Simulation results. (a) The spatial profile of the two sources simulated on the brain surface; the signal on the left hemisphere lies in the alpha band, whereas the signal on the right hemisphere lies in the alpha, beta and low‐gamma bands; (b) the significant activation regions obtained from the univariate approach (ANOVA), with FWER controlled over space and frequency; (c) the significant activation regions obtained from the multivariate approach (MANOVA), with FWER controlled over space.
