
Figure 3.
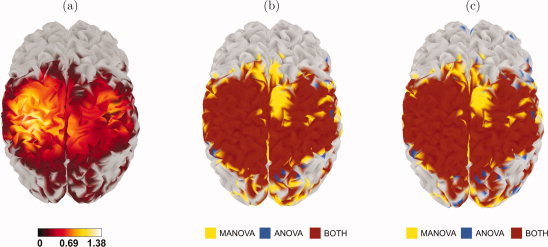
Results of the analysis with data from a visuomotor study. (a) Brain map of the R‐statistic, after thresholding for significance; (b) comparison between ANOVA (FWER corrected over space and frequency) and MANOVA; (c) comparison between ANOVA (FWER corrected over space) and MANOVA. In the last two maps, sources in red were detected by both methods, sources in yellow were detected by MANOVA only, and sources in blue were detected by ANOVA only.