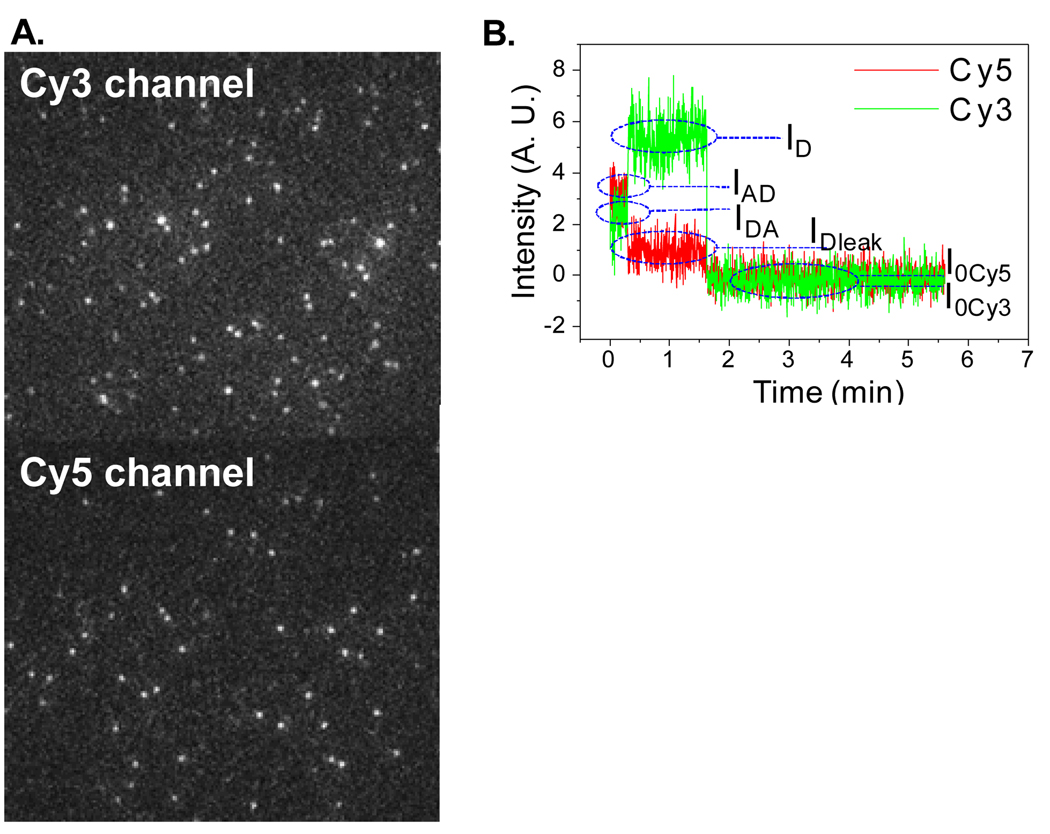
Fig. 3.
(A) Fluorescence images of dual-labeled pRNA in the complex, with the excitation for Cy3 only. (B) Typical time traces of fluorescence intensities of Cy3 and Cy5 FRET pair. ID: Intensity of donor without acceptor; IDA: Intensity of donor with acceptor; IAD: Intensity of acceptor due to FRET; IDleak: Intensity of donor leakage to acceptor channel; I0Cy3, I0Cy5: Baseline intensities for Cy3, Cy5.

