
Figure 4.
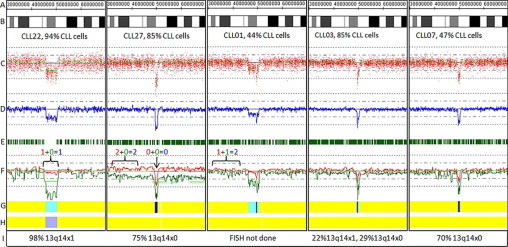
Copy number and length heterogeneity at the 13q14 locus in CLL. Genomic position (A); ideogram (B); raw log2ratios for each probe (C); smoothing average of log2ratio over 10 probes (D); heterozygous call bars (E); allele-specific analysis (F) (AsCNAR algorithm), as in Figure 3; hidden Markov model for copy number (G), as in Figure 2; hidden Markov Model for LOH likelihood (H) as in Figure 2; and FISH results (I) for 13q14 locus. The percentage of CLL cells present in the sample as determined by flow cytometry is provided below the ideogram. CLL22: heterozygous deletion; CLL27: homozygous deletion with aUPD of 13q; CLL01, CLL03, CLL07: Examples of partially heterozygous and partially homozygous deletions.