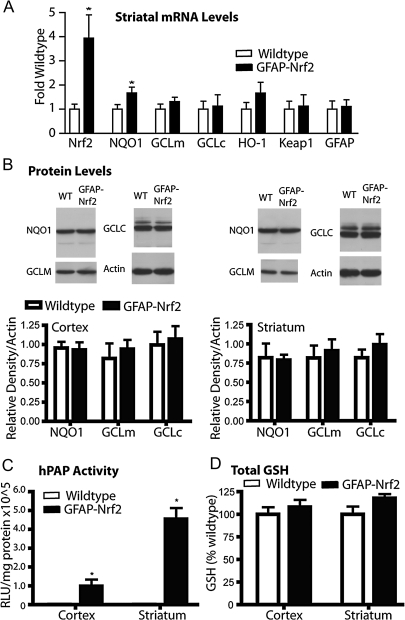
FIG. 3.
Cortical and striatal tissue from GFAP-Nrf2 transgenic mice shows only minor differences from wild-type mice. (A) Quantitative PCR for Nrf2-, GFAP-, Keap1-, and Nrf2-driven genes was performed on striatal tissue from wild-type and GFAP-Nrf2 transgenic mice. Data were normalized first to actin expression from the same tissue and then to wild type (n = 4 wild type, n = 4 GFAP-Nrf2). (B) Western blot analysis was performed to measure protein levels of Nrf2-driven genes in cortex and striatum. Data are normalized to actin (n = 4 wild type, n = 4 GFAP-Nrf2). (C) Activity for the ARE-hPAP reporter protein was measured in GFAP-Nrf2 transgenic, ARE-hPAP reporter mice as well as ARE-hPAP reporter mice alone. Data are normalized to protein and then background levels determined from ARE-hPAP–negative mice are subtracted (n = 3 wild type, n = 3 GFAP-Nrf2). (D) Total glutathione levels in cortex and striatum of GFAP-Nrf2 transgenic or wild-type mice were determined, normalized to protein, and then normalized to wild type values (n = 4 wild type, n = 4 GFAP-Nrf2). *p < 0.05 compared to GFAP-Nrf2 nontransgenic.

