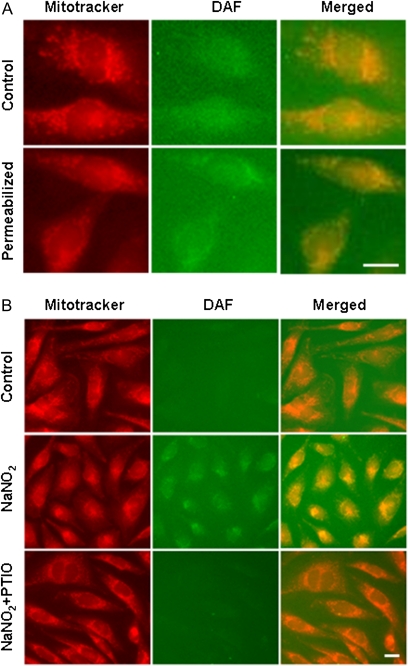
FIG. 2.
Fluorescence micrographs of NaNO2-mediated increase of mitochondrial NO. (A) Cells were loaded with MitoTracker Red and DAF-FM and then treated with NaNO2 (200μM) for 30 min. Whole cells = cells treated with NaNO2. Permeabilized = cells treated with NaNO2, followed by permeabilization with digitonin. Micrographs are images of MitoTracker Red, DAF, or merged fluorescence. (B) Reduction of nitrite-induced mitochondrial NO by loading cells with PTIO (200μM). Cells were pretreated with PTIO for 10 min and then incubated with NaNO2 for 30 min. Cellular fluorescence was monitored after permeabilization with digitonin. Scale bar = 25 μm.

