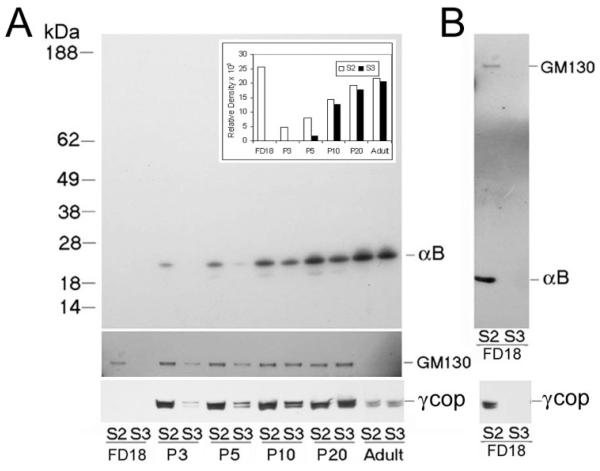
Figure 8.
Temporal study of the distribution of αB-crystallin in Golgi membrane and vesicular fractions in the developing lens. Postnuclear extracts were prepared from whole lenses of different ages and were analyzed on discontinuous sucrose density gradients (Fig. 3, inset). The Golgi membrane (S2) and vesicular membrane fraction (S3) were collected and diluted 1:10, and 1 μL was immunoblotted for αB-crystallin detection (A, top). No reaction was seen in the FD18 samples at this dilution, which were, therefore, immunoblotted again with 10 μL undiluted S2 and S3 fractions and probed sequentially with anti–αB-crystallin and anti-GM130 (B, top). The αB-crystallin immunoblot was scanned, and relative density values are presented in the bar graph (inset; FD18 values were taken from B). Note that the presence of αB-crystallin in the S3 fraction increases with developmental age. To establish that the S3 fraction contains Golgi-derived vesicles, two markers, GM130 and γCOP (a member of the COP1 coat protein complex involved in vesicle formation as part of the Golgi to ER transport) were followed.23,26 The presence and absence of αB-crystallin in the S2 and S3 fractions are complemented by the presence and absence of GM130 and γCOP. For GM130 and γCOP, undiluted fractions (10 μL) were used for immunoblotting (only relevant areas of the immunoblots are shown). In the adult lens, GM130 is undetectable. That the extraction procedures do not unduly contribute to the generation of vesicles (fraction S3) is indicated by the lack of αB-crystallin in the S3 fraction in the younger lenses (B). The following protein amounts (μg/μL) from each fraction were used for immunoblotting: (A) S2/S3, F18, 0.25/0.19; P3, 0.97/0.38; P5, 1.44/0.70; P10, 1.63/0.54; P20, 1.49/1.08; Adult, 1.63/1.45. (B) S2/S3, 2.5/1.9. Although this is a qualitative analysis, we also analyzed equal protein amounts; the pattern did not show significant change.

