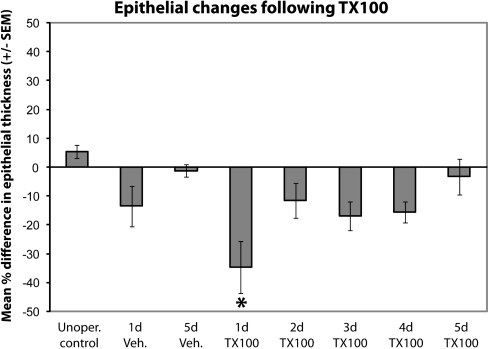
Figure 2.
Quantitative analysis of olfactory epithelial thickness following Triton X-100 application allowed comparison of epithelial changes. The percent difference in thickness of the OE between the internal control and treated sides of the 1 day post-detergent application group was confirmed by ANOVA to be different from unoperated control, 5 days post-vehicle, and 5 days post-lesion groups. For each group n = 3 and P < 0.05 was considered significant.

