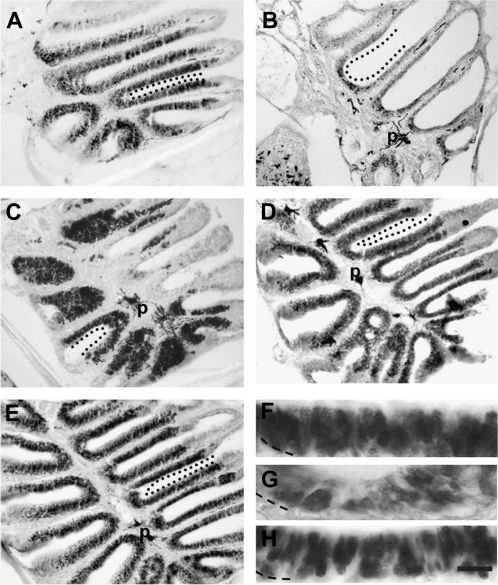
Figure 3.
Examination of distribution of mature and immature neurons using α-Hu analysis. (A) Heavy labeling for α-Hu was present in the sensory regions of the control rosette. (B) One day following chemical ablation of the OE, there were few α-Hu immunoreactive profiles in the olfactory rosette. (C) By 5 days after Triton X-100 treatment, the amount of α-Hu labeling had increased dramatically throughout the sensory areas of the rosette. Seven (D) and 14 (E) days after detergent treatment, Hu-positive profiles populated the entire OE. Control (F), 1d (G), and 5d (H) α-Hu labeled OEs at higher magnification show cellular distribution of the antibody label. Basement membrane is marked with a dashed line. Demarcated with dotted line (A–E) are areas of sensory epithelium along lamellae. p = pigment of the lamina propria in the central raphe and is not indicative of antibody labeling. Scale bar = 100 μm for A–E and 10 μm for F–H.

