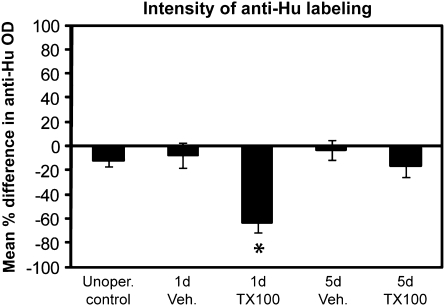
Figure 4.
Quantitative analysis of α-Hu OD allowed evaluation of changes to numbers of neurons present in epithelium. Percent differences in OD levels between treated and untreated nares of 3 animals from each group were calculated, and ANOVA was employed to confirm differences (P < 0.05 was considered significant). There was a significant difference in OD 1 day post Triton X-100 compared with unoperated controls and 5 day groups.

