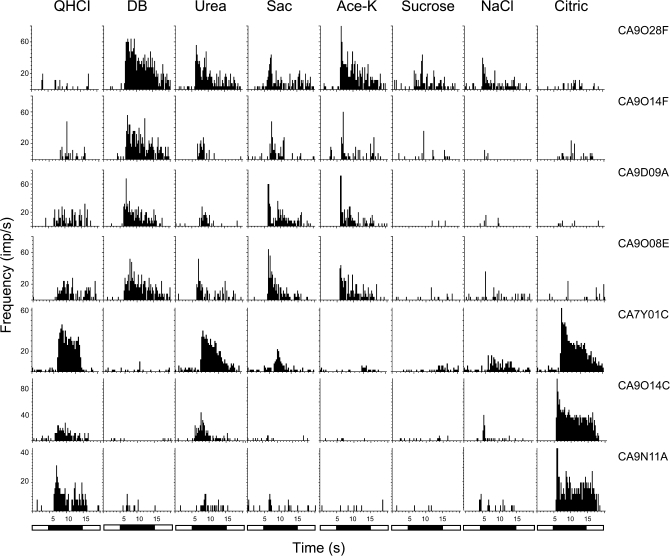
Figure 4.
Recordings of the temporal intensity or profile of 7 CT fibers before, during, and after stimulation are shown. The impulse activity of each fiber is displayed during 5 s of rinsing with artificial saliva, followed by 10 s of stimulation and then by 5 s of renewed rinsing with the artificial saliva. The vertical traces show the response to each stimulus listed on top of the graph: QHCl, DB, urea, caffeine, saccharin, acesulfame-K, sucrose, NaCl, and citric acid. Some of the features mentioned in Figure 1 are shown. Thus, it is evident that a response to QHCl is poorly correlated with the response to denatonium or a response to acesulfame-K with the response to sucrose.

