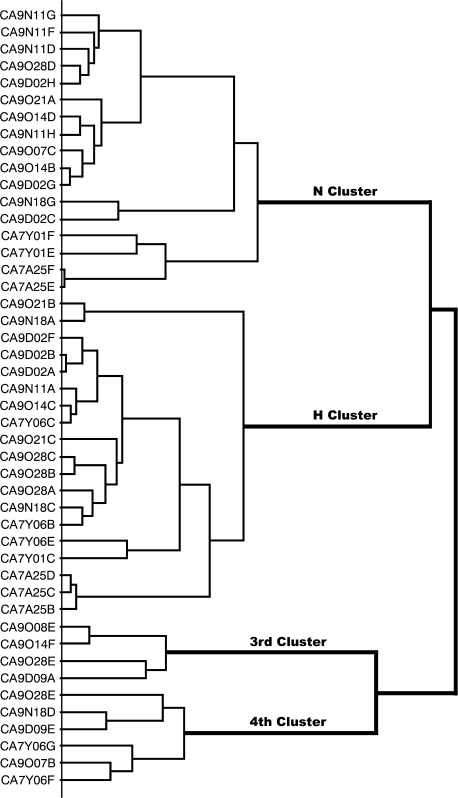
Figure 5.
Results of hierarchical cluster analysis of the response profile of 46 CT fibers. Intercluster similarity was measured with the Pearson correlation coefficient, and the cluster analysis proceeded according to the average linking method. The identity of the fiber is listed on the left side and response category on the basis of its best response to the 4 basic solutions is entered on the right side. The analysis distinguished 2 major clusters consisting of 17 N fibers and 19 H fibers and 2 clusters that could not be categorized according to human taste qualities. N stands for NaCl and H for citric acid.

