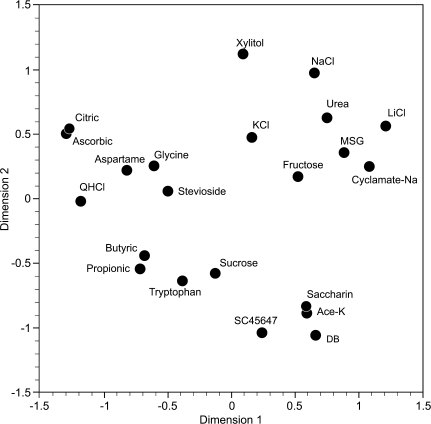
Figure 7.
The 2D space, showing location of 22 taste stimuli, was obtained from the MDS analysis. The distribution was calculated with Pearson correlation coefficient between stimuli across 46 CT fibers. The value of stress is 0.057. The plot shows that the stimuli did not group according to human taste qualities. For example, the compounds that to humans share the quality of being sweet do not form one group but are distributed among all the other stimuli; citric and ascorbic acid are located away from the other 2 acids, butyric and propionic acid; QHCl is distant from DB; urea in the vicinity of NaCl and LiCl.

