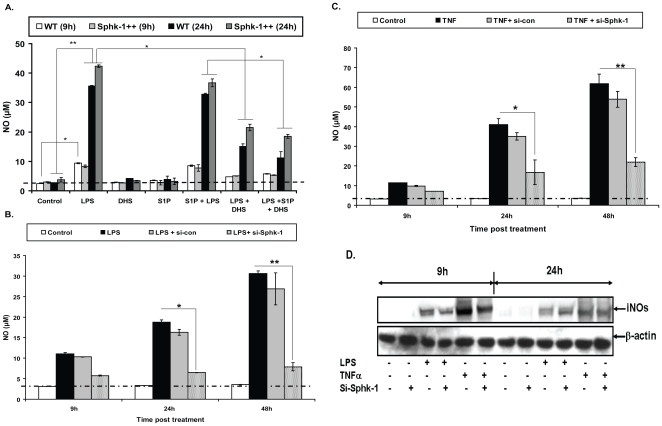
Figure 5. Sphk-1 are also involved in LPS/TNF induced NO generation in macrophages.
(A) WT and SphK-1++ macrophages were stimulated with LPS with and without S1P/DHS and NO was quantified at indicated time intervals. (B, C) Sphk-1 knockdown inhibits LPS and TNF-α induced generation of NO in macrophages. Both control and Sphk-1 knockdown macrophages were stimulated with LPS (B) and TNF-α (C) and NO was quantified at indicated time intervals. (D) The effect of Sphk-1 knockdown was validated in LPS or TNF-α induced generation of NO and expression of iNOs proteins at different time intervals. Shown here is the representative blot from two independent experiments. Data in all figures are represented as mean of µM ± SEM from three independent experiments. The dotted line in all figures represents the constitutive NO titre in macrophages. The values above this line represent the actual titre of NO induced by various treatments. **Indicates p≤0.01; * indicates p≤0.05).

