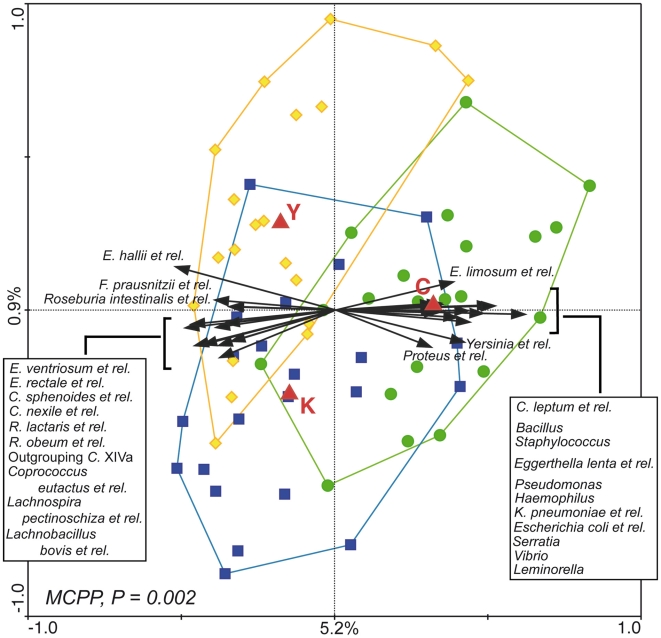
Figure 2. Triplot of the RDA of the microbiota composition of centenarians, elderly and young adults.
Subjects belonging to group C, E, and Y are indicated by green circles, blue squares and yellow diamonds, respectively. Constrained explanatory variables (C, E, and Y) are indicated by red triangles. Responding bacterial subgroups that explained more than 10% of the variability of the samples are indicated by black arrows. First and second ordination axes are plotted, showing 5.2% and 0.9% of the variability in the dataset, respectively. Log transformed data were used for the analysis. Bottom-left, P value obtained by MCPP is reported. Abbreviations: C., Clostridium; E., Eubacterium; F., Faecalibacterium; R., Ruminococcus; K., Klebsiella.

