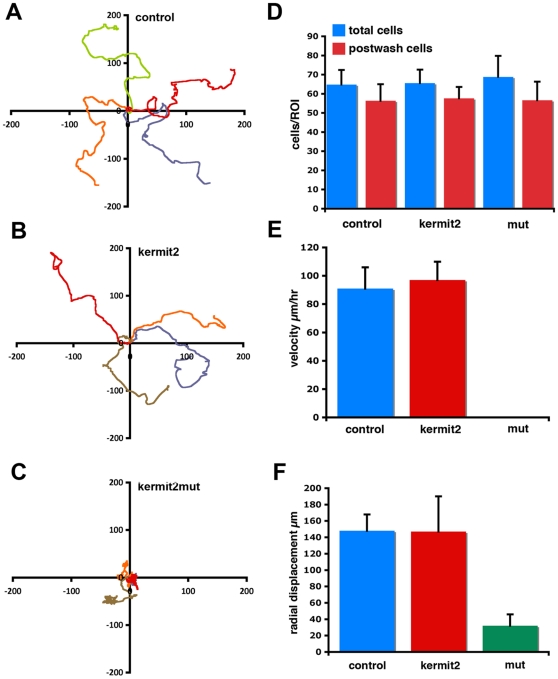
Figure 7. Cell adhesion assays.
(A–C) Spider graphs representing migration tracks of individual cells plated on FN substrates. Each graph contains 4 representative tracks with the start point set to (0,0). Horizontal and vertical scale is in µM. (C) Kermit2mut expressing cells have reduced migration paths as compared to (A) control and (B) kermit2 expressing cells. (D) Quantification of activin-treated cell adhesion to FN substrates. Cells were plated on FN substrates and counted pre-wash (blue) and after washing to remove non-adherent cells (red). Control, kermit2, and kermit2mut expressing cells all show similar affinity for FN substrates. (E) Activin-treated cell migration rate mediated by kermit2. Average cell migration velocities were measured using the track cells function of Openlab. The value for each construct represents the average (±SD) of 45 cells from three spawnings. Cells expressing the kermit2mut construct (0.6 µM/hr) migrate significantly (P<0.005) slower than control (91 µM/hr) or kermit2 (97 µM/hr) expressing cells. (F) The radial displacement of activin-treated cells on FN substrates. Measurements are from the same cells as represented in (E). Kermit2mut expressing cells travel significantly (P<0.01) less distance (32 µM) than control (148 µM) or kermit2 expressing cells (147 µM).

