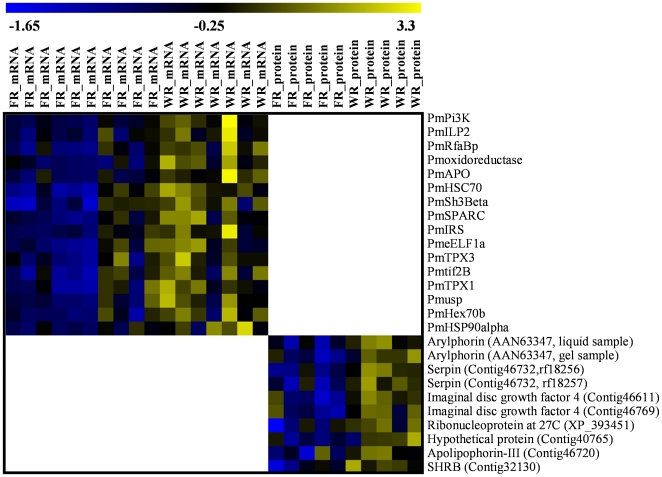
Figure 1. Heat map visualization of relative expression of sixteen genes and nine peptides.
Sixteen genes (upper) and 9 peptides (lower) significantly differentially expressed in foundress-reared (FR; putative worker-destined) vs. worker-reared (WR; putative gyne-destined) P. metricus fifth-instar larvae. Bar at top gives color scale of relative expression from the mean expression: downregulation = blue; upregulation = yellow. Z-transformed transcript and peptide/protein abundances visualized using TMeV version 4.3.02.

