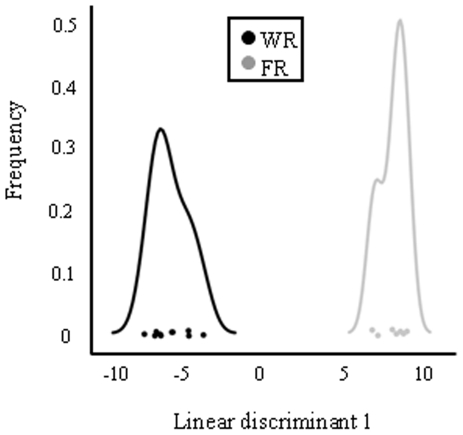
Figure 2. Linear discriminant (LD) analysis of 12 genes significantly different at the mRNA level.
Linear discriminant analysis of 12 genes significantly different at the mRNA level clearly separated foundress-reared (FR; putative worker-destined) and worker-reared (WR; putative gyne-destined) larvae. X axis = LD value; Y axis = LD value frequencies. 88% of individuals were correctly classified as FR or WR based on LD values.

