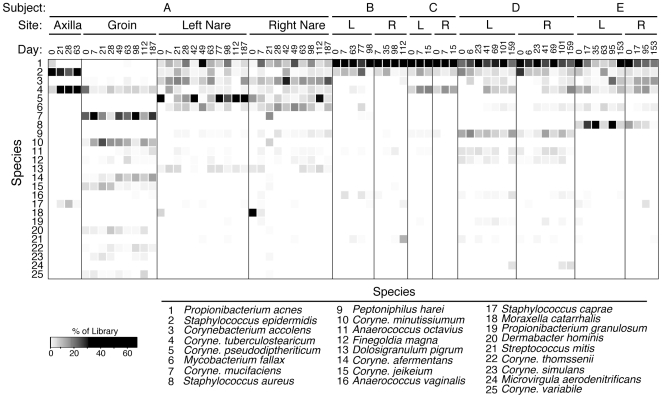
Figure 1. Relative abundance of predominant bacterial taxa followed longitudinally in healthy adults.
Shading indicates the proportion of each rDNA library represented by a particular rDNA sequence type. Rows represent species or genus-level taxonomic groups and columns represent individual specimens. Data are presented only for the 25 most abundant taxa, which account for 90% of rDNA sequences analyzed.

