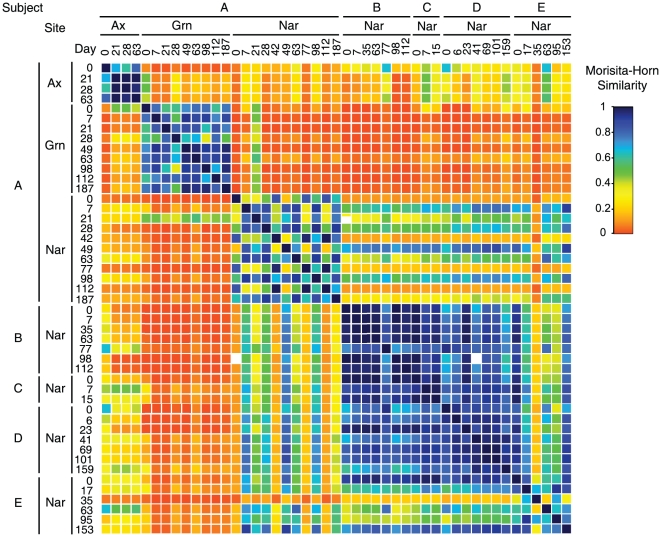
Figure 2. Similarities between microbiotas determined longitudinally for healthy adults.
Morisita-Horn Community Similarity Indices (CMH) were calculated for each pairwise combination of samples and plotted as a heatmap that compares all values. Color gradient denotes CMH values, which range from 0.0 (no similarity between communities) to 1.0 (identical communities). Ax: Axilla samples. Grn: Groin samples. Nar: Nares samples.

