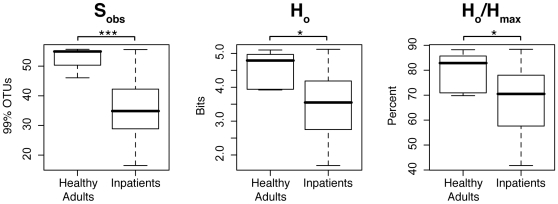
Figure 8. Ecological richness and diversity of nares microbiotas.
The top panel presents the distributions of species richness indices (Sobs) calculated for nares specimens obtained from hospitalized or healthy adults. The middle panel summarizes sample biodiversity (Shannon diversity index Ho) and the lower panel presents species evenness (Ho/Hmax. Ho = Shannon index; Hmax = maximum value of Ho for a specimen). Significance levels are indicated by * p<0.05; *** p<0.001.

