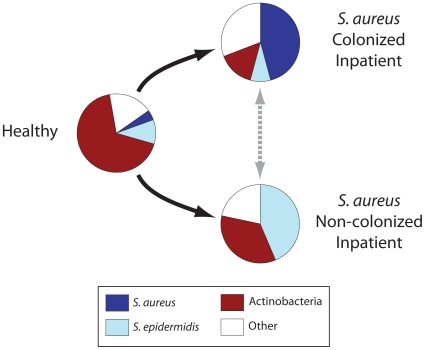
Figure 10. Distinct microbial populations in healthy and hospitalized adults.
Pie charts depict average frequencies of dominant microorganisms in the anterior nares of healthy adults and inpatients, classified by S. aureus carriage status. Arrows outline possible pathways by which microbial populations develop in hospitalized patients. “Other” represents less abundant taxa, such as Proteobacteria and Firmicutes other than S. aureus and S. epidermidis.

