
Figure 1. Unsupervised classification with both principal component analysis (PCA) and hierarchical clustering of 84 endometrium samples during the pre-receptive and receptive stages from natural and stimulated cycles.
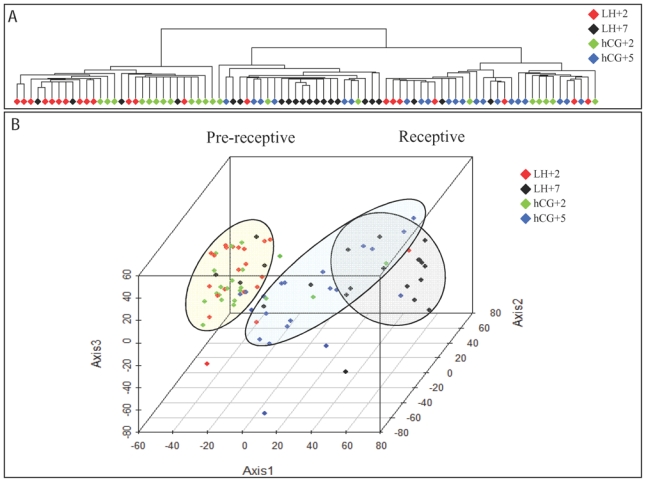
(A) Unsupervised hierarchical clustering was performed, allowing a separation between the pre-receptive (LH+2 and hCG+2) and receptive samples (LH+7 and hCG+5). (B) PCA using the three dimensions was performed representing 43% of the data information, and confirmed the unsupervised cluster analysis. Pink circle, LH+2 and hCG+2 samples; grey circle, LH+7 samples; green circle, hCG+5 samples.