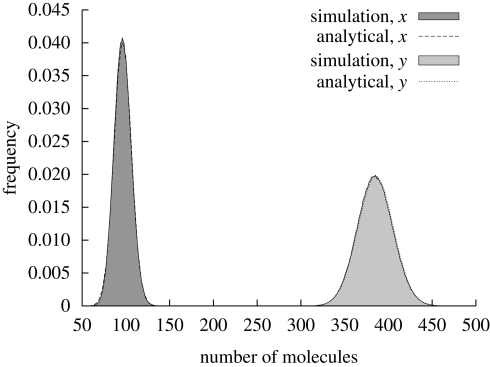
Figure 2.
Comparison between analytical solution and simulation data. We considered a cell volume of V = 8 × 10⁻¹⁶ l. The following set of parameters have been used: h = 3, K = 0.5 µM, L = 0.2 µM, H = 0.8 µM and μ = 1 min−1. At steady state, the two species have the following concentrations: x = 0.2 µM and y = 0.8 µM. The probability distribution of species x and y can be approximated by normal distributions.

