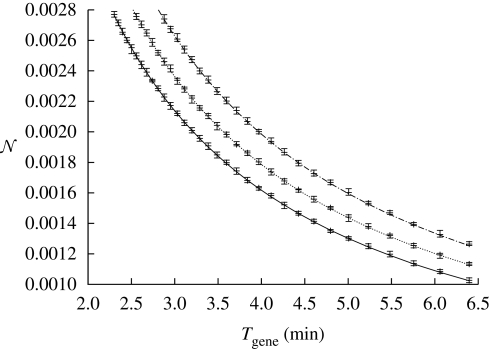
Figure 4.
Comparison of various α at fixed metabolic cost. We plot the speed and noise (per molecule based on the concentrations given below and the typical volume of E. coli) trade-off for different leak rates under fixed metabolic cost. The metabolic cost of the three curves is constant, ζ = 0.8 µM min−1. We consider three cases: αy = 0 µM min−1 (solid line), αy = 0.05 µM min−1 (dashed line) and αy = 0.10 µM min−1 (dashed dotted line). The following set of parameters have been used: x = 0.2 µM, K = 0.5 µM, h = 3. The degradation rate was varied in interval μ ∈ [1,0.36] (min−1). We considered a cell volume of V = 8 × 10⁻¹⁶ l.

