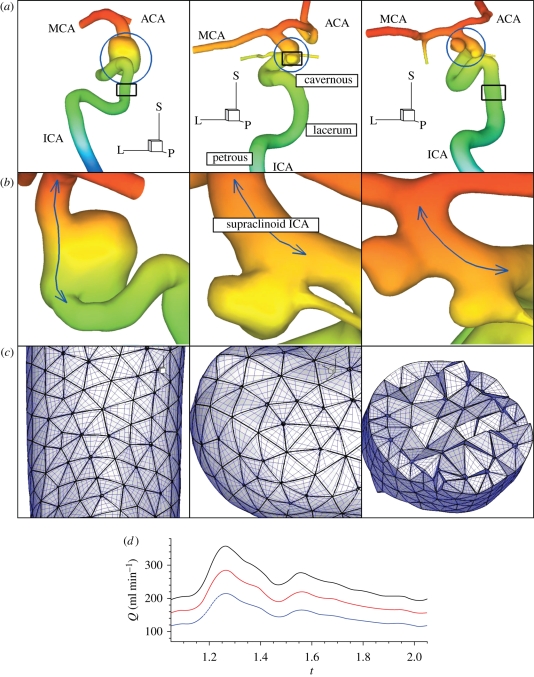
Figure 1.
(a) Geometric models of patients A (left), B (middle), and C (right) defined in table 1. (b) Zoom-ins of aneurysms indicated by blue circles in (a). The blue lines indicate the centre of the supraclinoid ICA segment, which is the region of interest in this study, harboring aneurysms in patients A, B, and C. Colours represent z-coordinates for viewing clarity. All shown arteries are on the left from the median plane and aneurysms are located at the level of eyes and below the right ventricles and above the intracranial base. ‘L’, ‘P’ and ‘S’ denote lateral (x), posterior (y) and superior (z) directions, respectively. (c) Surface elements and elements with quadrature points in a cut marked with rectangles in (a). (d) The volumetric flow-rate profile over the cardiac cycle at different average volumetric flow rates: 150 ml min−1, blue-dashed line; 200 ml min−1, red-dashed line; 250 ml min−1, solid black line.

