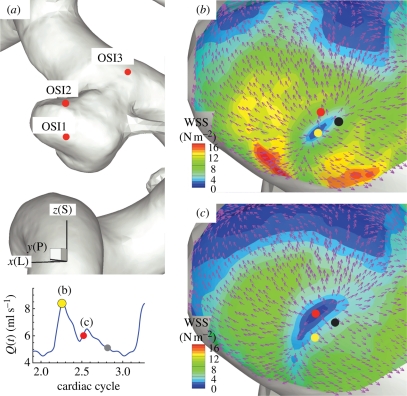
Figure 11.
Patient B (case BL, VFR = 350 ml min−1): WSS vectors around the impingement (stagnation) point inside the aneurysm. (a) Locations of high OSI: ‘OSI1’, ‘OSI2’ and ‘OSI3’. x(L), y(P) and z(S) refer to lateral, posterior and superior directions respectively. (b) Plot of WSS magnitude and WSS vectors around the region ‘OSI1’ at the systolic peak. (c) Plot of WSS magnitude and WSS vectors around the region ‘OSI1’ at an instant during the decelerating systole, which is marked with the red dot on the left bottom VFR plot. The dots show the instantaneous locations of the centre of the stagnation point at times marked with the dots of the same colour at the left bottom VFR plot.

