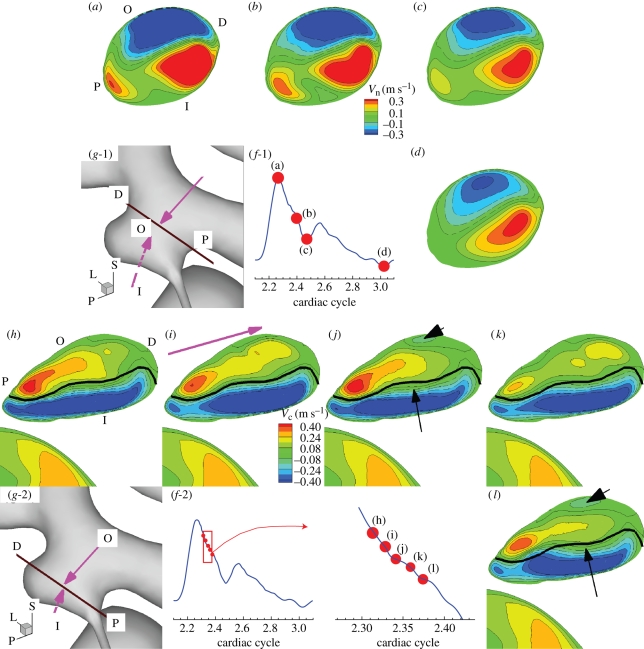
Figure 12.
Patient C (case CH, VFR = 200 ml min−1): distribution of normal or parallel velocity on a plane cutting through the aneurysm. In (a)–(d), positive velocity means flow out of the plane, showing inflow and outflow. In (h)–(l), positive means flow along the direction marked with the pink arrow in (i). This plane is taken at the neck and near the fundus of the aneurysm as shown in (g-1,2). (a–d) Normal velocity distribution at different phases of the cardiac cycle from the dicrotic peak, end of diastole, systolic peak and decelerating systole, respectively. (a,h) Letters ‘O’, ‘I’, ‘D’, and ‘P’ indicate the locations of the outer side of the bend at the upstream aneurysm, of the inner side of the bend at the upstream aneurysm, of the distal portion of the aneurysm, and of the proximal portion of the aneurysm, respectively. ‘L’, ‘P’, and ‘S’ denote lateral, posterior and superior directions, respectively. (f-1,2) and (g-1,2) show the time instants when the velocity fields are taken. (h–l) Distribution of centreline velocity on the plane cutting through the aneurysm near the fundus of the aneurysm at five time instants marked with red dots at (f-2). Black lines in (h)–(l) mark the border line between positive and negative regions of (i). The black arrows in (j) and (l) mark the area where changes from (i) and (k) are pronounced.

