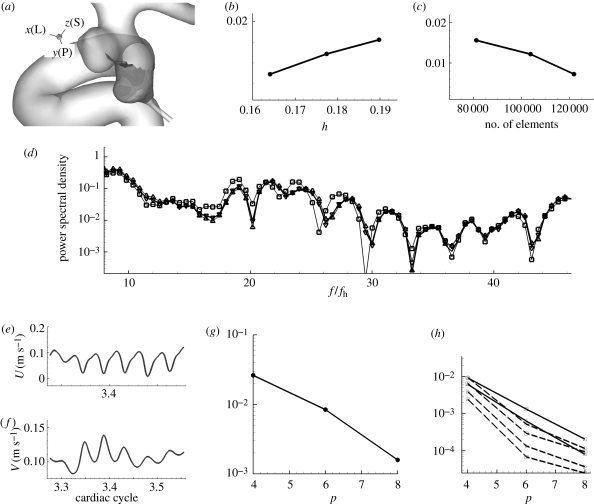
Figure 15.
(a) A patch where WSS errors are computed in reference to the highest polynomial order simulation (p = 10) or the finest mesh with higher order (p = 6). Shading on the patch in the upstream aneurysm represents the x component of WSS vector at the systolic peak. (b) Plot of WSS L2 error at the patch, which covers the upstream aneurysm walls, versus the largest edge length. (c) Plot of WSS L2 error versus the number of elements. (d) The spectra at a history point inside the upstream aneurysm at different meshes. (e) Velocity–time traces at history point pt 1 inside the upstream aneurysm from four simulations with different polynomial order p = 4, 6, 8, and 10. (f) Velocity–time traces at history point pt 10 inside the downstream aneurysm from four simulations with different polynomial order p = 4, 6, 8, and 10. The differences between them, however, are not visually discernible. (g) p-convergence of L2 error in WSS at the patch, which covers the upstream aneurysm walls, shown on the left during the time interval indicated with a grey box in figure 6. (h) L2 error of pointwise velocity at several history points shows spectral (exponential) convergence. (d) Square solid line, 80 000; triangle solid line, 103 000; inverted triangle solid line, 120 000; solid line, reference (h) Square solid line, pt 1; triangle solid line, pt 2; square dashed line, pt 4; diagonal triangle dashed line, pt 6; diamond dashed line, pt 9; circle dashed line, pt 10.

