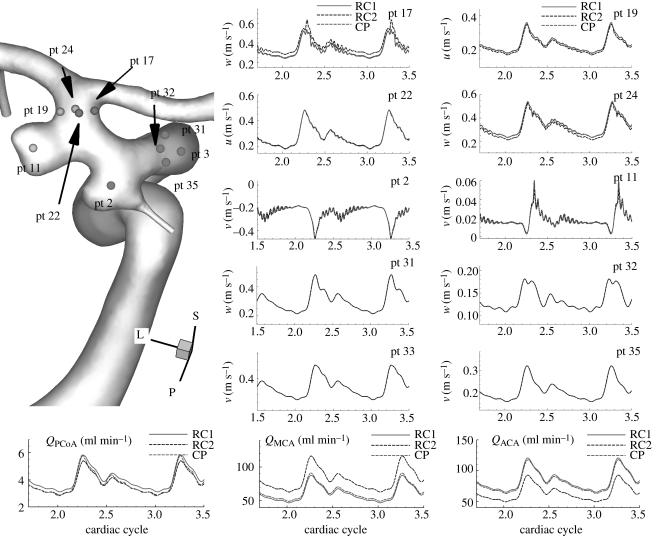
Figure 16.
Patient C (case CL, VFR = 150 ml min−1): comparison of velocity–time traces at history points upstream and downstream of the aneurysms among different outflow boundary conditions. Velocity–time traces at the upstream history points show that the upstream flow is stable over the cardiac cycle and instability occurs in the aneurysms. ‘RC1’, ‘RC2’, and ‘CP’ refer to RC-type 1, RC-type 2 and constant pressure outflow boundary conditions, respectively.

