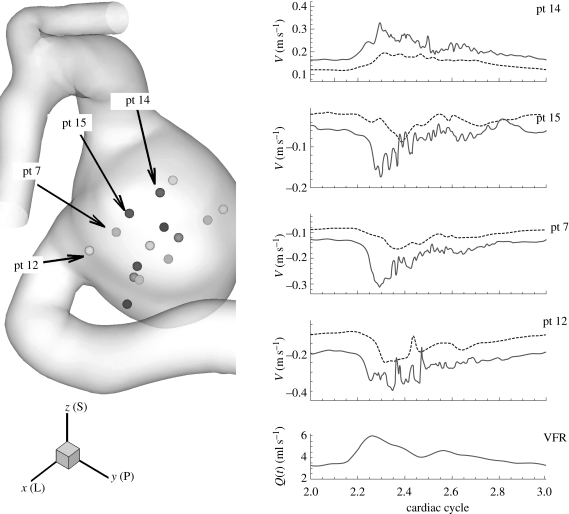
Figure 4.
Patient A (case AH, VFR = 250 ml min−1): velocity–time traces at four history points. Right bottom shows the plot of VFR versus time within the third cardiac cycle. The oscillations start during the decelerating systole. A case VFR = 150 ml min−1 is shown for comparison purposes. x(L), y(P) and z(S) denote lateral, posterior and superior directions, respectively. Dashed line, VFR = 150 ml min−1; solid line, VFR = 250 ml min−1.

