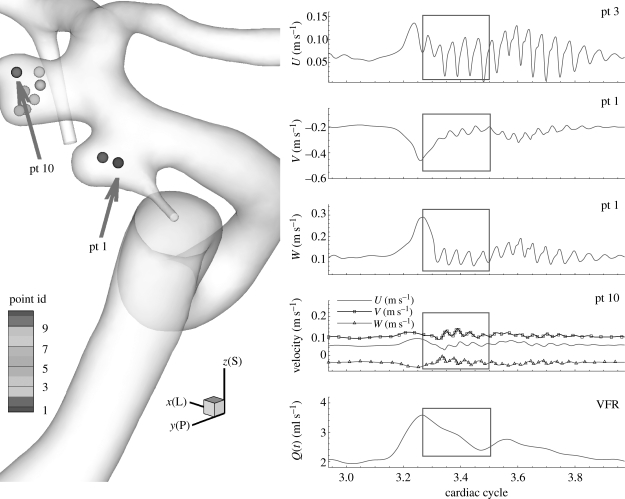
Figure 6.
Patient C (case CL, VFR = 150 ml min−1): time traces at history points inside the aneurysm for velocity convergence test. U, V and W components at pt 1 and pt 10 are plotted on the right and the time-dependent flow rate is also plotted for phase comparison. The grey boxes show the time interval where the velocity and WSS errors are measured among different polynomial orders. U, V and W denote x (lateral), y (posterior) and z (superior) components of fluid velocity, respectively.

