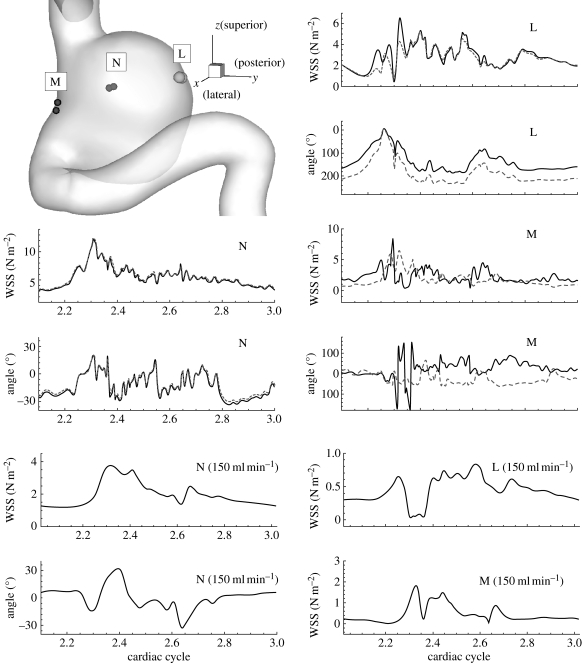
Figure 8.
Patient A (case AH, VFR = 250 ml min−1): left top shows the regions where WSS vectors are calculated; each region has two discrete points corresponding to the two curves in each plot. Time traces of magnitude and direction of WSS vectors at each point are shown for each region ‘L’, ‘M’ and ‘N’. The angle of a WSS vector is calculated with reference to corresponding WSS vectors at the systolic peak. WSS time traces at VFR = 150 ml min−1 are shown for comparison purposes.

