Abstract
The elastic strain energy potential for nonlinear fibre-reinforced materials is customarily obtained by superposition of the potentials of the matrix and of each family of fibres. Composites with statistically oriented fibres, such as biological tissues, can be seen as being reinforced by a continuous infinity of fibre families, the orientation of which can be represented by means of a probability density function defined on the unit sphere (i.e. the solid angle). In this case, the superposition procedure gives rise to an integral form of the elastic potential such that the deformation features in the integral, which therefore cannot be calculated a priori. As a consequence, an analytical use of this potential is impossible. In this paper, we implemented this integral form of the elastic potential into a numerical procedure that evaluates the potential, the stress and the elasticity tensor at each deformation step. The numerical integration over the unit sphere is performed by means of the method of spherical designs, in which the result of the integral is approximated by a suitable sum over a discrete subset of the unit sphere. As an example of application, we modelled the collagen fibre distribution in articular cartilage, and used it in simulating displacement-controlled tests: the unconfined compression of a cylindrical sample and the contact problem in the hip joint.
Keywords: composite material, fibre-reinforced, statistical orientation, biological tissue, articular cartilage
1. Introduction
The nonlinear elasticity of composite materials reinforced by one or more families of fibres, each oriented in a given direction, has often been modelled by means of the so-called superposition method (e.g. Weiss 1994; Holzapfel et al. 2000; Holzapfel & Gasser 2001): the elastic strain energy potential of the composite is given by the sum of a (typically isotropic) term representing the non-fibrous matrix, and as many anisotropic terms as the fibre families. This method has often been used to model biological soft tissues.
Biological tissues are multi-phasic materials, composed of a solid phase and a fluid phase in which several chemical species are dissolved (Fung 1981). The solid phase can be represented as a composite material, in which the matrix is reinforced by collagen fibres. Tissues characterized by one family of fibres are, for example, tendons and ligaments (Weiss & Gardiner 2001), whereas examples of tissues with two families are the annulus fibrosus of intervertebral discs (White & Panjabi 1978) and the adventitial layer of blood vessels (Canham et al. 1989). Articular cartilage is instead an example of tissue characterized by a location-dependent fibre arrangement that cannot be represented with a finite number of fibre families. The fibres are roughly aligned in the deep zone, randomly oriented in the middle zone, and parallel to the surface in the superficial zone (Mollenhauer et al. 2003).
A composite material with such a complex fibre arrangement can be treated in statistical terms, i.e. at each material point, a probability distribution density function provides the probability of finding a fibre oriented in a given direction. This approach was first proposed by Lanir (1983), and widely used in subsequent works (e.g. Hurschler et al. 1997; Billiar & Sacks 2000; Sacks 2003; Gasser et al. 2006). Similar results (with the same formalism that shall be used in this paper) were independently found by Federico et al. (2004). Gasser et al. (2006) proposed to account for fibres with statistical orientation by calculating the directional average of the structure tensor, an approach that has been adopted in later works (e.g. Menzel et al. 2008). A microplane model based on stress directional averaging has been proposed by Caner & Carol (2006).
Recently, Federico & Herzog (2008c) generalized the elastic strain energy potential superposition method, by extending it to the case of composites with statistical fibre orientation, obtaining an integral form of the elastic strain energy potential, the integral being performed on the unit sphere 𝕊2 representing the set of all possible directions in the natural space ℝ3 (i.e. the solid angle). The deformation features in the integrand function and, except for a limited number of particular cases, this prevents the reduction of the integral to an expression involving only structural parameters (and no deformation), and the direct analytical use of the potential. Although this is a limitation from the theoretical point of view, the numerical implementation of this elastic potential is possible.
The purpose of this work is twofold. On the theoretical side, it is aimed at studying the convexity of the elastic potential resulting from the generalized superposition method. On the computational side, its objective is to provide a robust numerical implementation of the integration of the potential, the stress and the elasticity tensor. The numerical evaluation of the integrals is performed using the method of spherical designs (Hardin & Sloane 1996; Hardin et al. 2008), i.e. discrete subsets of the unit sphere 𝕊2, such that the integral of a polynomial on 𝕊2 equals its discretized counterpart evaluated as its average value at the points belonging to the spherical design. The integration method was tested by modelling an articular cartilage unconfined compression test and the articular contact in the hip.
2. Theoretical Background
Following standard notation (e.g. Marsden & Hughes 1994), χ is the configuration, mapping points X = (X1, X2, X3) in the reference configuration ℬ ⊆ ℝ3 into points x = (x1, x2, x3) in the natural Euclidean space 𝒮 = ℝ3, the tensor F with components FiI = ∂χi/∂XI is the deformation gradient, J = det F is the volumetric deformation ratio, and C = FTF is the right Cauchy deformation tensor.
The deformation gradient can be written in the so-called volumetric-distortional decomposition (Flory 1961; Ogden 1978)
| 2.1 |
where F̄ = J−1/3F is the purely distortional (or isochoric, or unimodular) part of the deformation, with det F̄ = 1. Note that, if there is no distortional deformation, F̄ equals the shifter ϒ (in Cartesian coordinates, with collinear material and spatial reference frames, ϒiI = δiI), and the total deformation gradient F describes a purely volumetric deformation: F = J1/3ϒ. From the decomposition of F̄, it follows that C = J2/3C̄ and C̄ = F̄TF̄ = J−2/3C.
For a hyperelastic material with elastic strain energy potential W, seen as a function of the Cauchy deformation tensor C, the second Piola–Kirchhoff stress S and the material elasticity tensor ℂ are given by
 |
2.2 |
The Cauchy stress σ and the spatial material elasticity tensor ℂ are obtained from equations (2.2) by means of an inverse Piola transformation (e.g. Marsden & Hughes 1994)
| 2.3a |
and
| 2.3b |
For the case of nearly incompressible materials, such as biological soft tissues, the elastic strain energy potential can be assumed to be fully decoupled in the volumetric and the distortional parts of the deformation, and can be written as the sum of a purely volumetric term U, a function of the volumetric deformation ratio, J, and a purely distortional term W̄, a function of the distortional right Cauchy deformation tensor, C̄ (Simo et al. 1985):
| 2.4 |
Remark. The decoupled potential (2.4) is only appropriate for nearly incompressible or incompressible materials. For the case of anisotropic compressible materials, an additional interaction term, in both J and C̄, would be needed to account for non-spherical deformations induced by spherical (hydrostatic) stresses, and non-spherical stresses induced by spherical (volumetric) deformations (Guo et al. 2008; Sansour 2008; Federico 2009), and to guarantee the consistency (Quintanilla & Saccomandi 2007) of the linear elasticity tensor obtained from the nonlinear constitutive equations with that obtained directly from small-strain experiments (Federico in press). However, a complete description, also suitable for anisotropic compressible materials, is not within the aims of this work.
With the decoupled potential (2.4), the Cauchy stress is directly split into its spherical and deviatoric components, and the spatial elasticity tensor is fully decoupled (Miehe 1994; Weiss et al. 1996). Their expressions are given by
| 2.5a |
| 2.5b |
| 2.5c |
and
| 2.6a |
| 2.6b |
 |
2.6c |
where p = −∂U/∂J is the hydrostatic pressure, K = ∂2U/∂J2 is the (large strain) bulk modulus, σ̃ = J−1χ*[2∂W̄/∂C̄] and ℂ̃ = J−1χ*[4∂2W̄/∂C̄2]. Tensor i is the spatial second-order identity, with components iij = δij, and
| 2.7a |
| 2.7b |
| 2.7c |
are the spatial fourth-order symmetric identity, spherical operator and deviatoric operator, respectively (e.g. Walpole 1981; Federico in press), with the special tensor products  and
and  as defined by Curnier et al. (1995).
Note. In equations (2.5)–(2.7), the notation is as in Federico (in press), which differs from that of Gasser & Holzapfel (2002) and Gasser et al. (2006), who work in terms of the Kirchhoff stress τ = χ*[S] rather than the Cauchy stress σ = J−1τ, define ℂ as the push-forward χ*[ℂ] rather than the inverse Piola transform J−1χ*[ℂ], incorporate the term J−4/3 into ℂ̃ and denote the spatial deviatoric operator 𝕄 by ℙ.
3. Methods
The elastic strain energy potential for a composite material with fibres obeying a given statistical distribution of orientation is constructed starting from that of a composite material with a finite number of fibre families, each aligned in a specific direction, by means of a passage from a sum to an integral. Then, the stress and elasticity tensor are obtained as the first and second derivative of the elastic potential with respect to a suitable measure of strain. This section also describes the ‘technical’ use of the probability distribution of the fibre orientation, as a function of angular coordinates.
3.1. Fibre-reinforced composite materials
Composite materials with a finite number of fibre families have been described by means of the superposition method (e.g. Weiss 1994; Holzapfel et al. 2000; Holzapfel & Gasser 2001), in which the elastic strain energy potential is the linear combination of those of the matrix and each fibre family. This class of materials is generalized to the case of statistically oriented fibres, by transforming the sum of the fibre terms into an integral over the unit sphere 𝕊2 = {M ∈ ℝ3 : ‖M‖ = 1} (the set of all directions in space), weighted by a probability distribution density function ψ, such that ψ(M) gives the probability of finding a fibre aligned with direction M. The function ψ must obey the symmetry condition ψ(M) = ψ(−M), and the normalization condition ∫𝕊2 ψ dS = 1. For nearly incompressible matrix and fibres (see §2 and the remark therein), the distortional elastic strain energy potential can be written as (Federico & Herzog 2008c)
| 3.1 |
where ϕ0 and ϕf are the volumetric fractions of the matrix and the fibres, respectively, and the integral
| 3.2 |
is called ensemble fibre potential, representing the linear superposition of the effect of all fibres, with A(M) = M ⊗ M being the structure tensor associated with direction M, written as an explicit function of M. We remark that, as in the case described by Holzapfel et al. (2000), of a finite number of fibre families, the linear superposition of the potentials implies no fibre–matrix shear interaction, as well as no fibre–fibre interaction.
It has been shown (Federico & Herzog 2008c) that the integral in equation (3.2) can be reduced to an analytical form not involving the deformation only in a few particular cases.
3.2. Tension–compression asymmetry and the anisotropic ensemble fibre potential
The fibres are known to give a much larger contribution in tension than in compression. This behaviour is often described by assigning the fibres a potential that is ‘active’ in tension and vanishes in compression, which describes them as having exactly zero stiffness when in compression. A more realistic representation of the asymmetric tension–compression behaviour of the fibres can be achieved by expressing the fibre potential W̄f as the sum of an isotropic term and an anisotropic term, the latter being different from zero only when the fibre is in tension (Federico & Herzog 2008c), i.e. when the distortional invariant Ī4(C̄, A(M)) = C̄ : A(M) is greater than one. Note that Ī4 (C̄, A(M)) is the distortional stretch λ̄M2 in the direction M of the fibre, which equals the distortional fibre stretch, in the hypothesis of perfect matrix–fibre bonding. Thus, the fibre potential can be expressed as
| 3.3 |
where W̄fi is an isotropic potential, active in both tension and compression, and W̄fa is a base anisotropic potential that is switched on when the fibre is in tension, by means of the Heaviside step function ℋ evaluated at Ī4(C̄, A) − 1. Substituting equation (3.3) into (3.2), the potential of the composite becomes
| 3.4 |
where ∫𝕊2 ψW̄fi(C̄) dS = W̄fi (C̄) because W̄fa does not depend on the direction and ψ is normalized to one, and the integral term
| 3.5 |
is called anisotropic ensemble fibre potential.
3.3. Potential and isochoric stress and elasticity tensor
For the finite element implementation of the anisotropic ensemble fibre potential W̄ea, we follow Gasser & Holzapfel (2002) and calculate the isochoric Cauchy stress σ̄ea and the isochoric spatial elasticity tensor ℂ̄ea. In order to perform the derivatives involved in these calculations, avoiding the non-differentiability involved by the presence of the Heaviside function, the integral in equation (3.5) can be restricted to the subset of the unit sphere on which Ī4(C̄, A(M)) − 1 is positive
| 3.6 |
and the integral (3.5) becomes
 |
3.7 |
As for the analytical form of the anisotropic base fibre potential W̄fa, following Weiss et al. (1996), we assume it to be a function solely of the invariant Ī4. It is convenient to report the derivative of Ī4 with respect to C̄
| 3.8 |
The second derivative is identically equal to the null fourth-order tensor 𝕆. The first and second derivatives of a scalar function f of Ī4, with respect to C̄, are then
| 3.9a |
and
 |
3.9b |
where f′ and f″ are the derivatives of f with respect to Ī4.
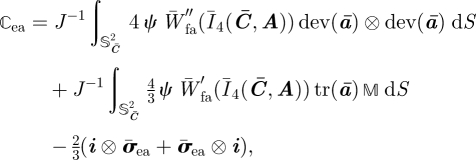
Following the arguments in §2 and using equations (3.7) and (3.9), the isochoric Cauchy stress σ̄ea and the isochoric spatial elasticity tensor ℂ̄ea associated with W̄ea read
 |
3.10 |
and
 |
3.11 |
where
 |
3.12 |
is the isochoric push-forward of the structure tensor A, expressed in terms of the spatial isochoric fibre direction m̄ = F̄M, with deviatoric part dev(ā) = 𝕄 : ā, and trace given by
 |
3.13 |
Therefore, the positivity of tr(ā(M)) = m̄ · m̄ = Ī4(C̄, A(M)) can be used to verify whether a fibre is in tension. Note that the conventional push-forward of the structure tensor is given by a(M) = m ⊗ m = (FM) ⊗ (FM).
3.4. Transversely isotropic probability distribution
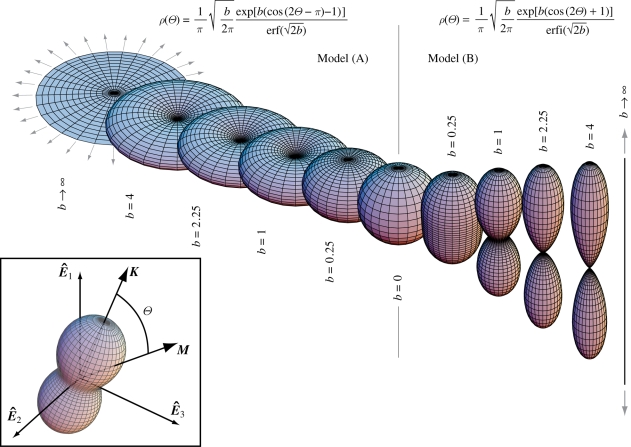
In many applications, it is convenient to evaluate the directional average integrals in polar coordinates. If {N̂1, N̂2, N̂3} is any orthonormal basis of ℝ3 (not necessarily coincident with the canonical basis {Ê1, Ê2, Ê3}), and K = N̂1 is chosen as the polar axis, a given unit vector M is given as a function of the co-latitude Θ from the polar axis K = N̂1 and longitude Φ from the N̂1–N̂2 plane (see the box in figure 1):
 |
3.14 |
Figure 1.
Transversely isotropic probability distribution density functions describing fibre orientation, mapping points M on the unit sphere into the real numbers. Surface plots are defined by the vector ρ(Θ)M and ρ is based on the von Mises distribution. The limit case of b = 0 describes isotropy, and the limit case of b → ∞ describes planar isotropy for ‘Model (A)’ defined by equation (3.19a) and fibres all aligned in the polar direction for ‘Model (B)’ defined by equation (3.19b). The box in the left-bottom corner describes the general case in which the polar direction K does not coincide with any of the axes of the canonical basis {Ê1, Ê2, Ê3}.
Hence, the probability distribution can be written as a function of Θ and Φ:
| 3.15 |
and the directional average of any function f of M becomes
 |
3.16 |
If the probability distribution is transversely isotropic with respect to the polar direction K = N̂1, then the probability function ρ depends only on the co-latitude angle Θ and not on the longitude Φ. In this case, the normalization condition becomes
| 3.17 |
If a transversely isotropic distribution tends to the Dirac delta distribution centred at Θ = π/2 and Θ = 0, then it represents the limit cases of fibres randomly oriented in the transverse plane (planar isotropy) and fibres all aligned in one direction, respectively. In order to include these two limit cases, we follow the procedure described by Gasser et al. (2006) and consider the π-periodic von Mises distributions ρM(Θ) centred at Θ = π/2 and Θ = 0, respectively, given by
 |
3.18a |
and
 |
3.18b |
where I0(b) = (1/π)∫0πexp(b cos Θ) dΘ denotes the modified Bessel function of the first kind of order zero. Normalization of ρM according to equation (3.17) leads to the orientation probability distribution functions
 |
3.19a |
and
 |
3.19b |
where erf(x) and erfi(x) = −i erf(ix) denote the error function at x and the imaginary error function at x, respectively (Weisstein 2005). The dispersion about Θ = π/2 in equation (3.19a) (Model (A)) and about Θ = 0 in equation (3.19b) (Model (B)) is described by the concentration parameter b (roughly the inverse of a concentration; Gasser et al. 2006). In the former case, b → ∞ describes fibres all lying on the plane, in the latter case, b → ∞ describes fibres all aligned in one direction. In both cases, the limit b →0 represents isotropy. The transversely isotropic orientation probability distributions described above are illustrated in figure 1, where surface plots defined by the vector ρ(Θ)M have been used.
It is important to note that, in this approach, it is only required to know the fibre orientation in the reference configuration. The reorientation of the fibres in the current configuration can be tracked by pushing forward the reference direction M to m = FM.
4. Convexity of the Anisotropic Ensemble Fibre Potential
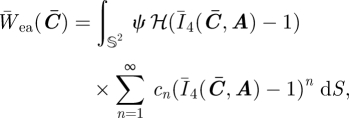
In order to study the convexity of the anisotropic ensemble fibre potential, we use the expression in equation (3.5) and, following the Moonley–Rivlin approach, we assume to be able to express W̄fa as a Taylor series in Ī4 − 1:
 |
4.1 |
The anisotropic ensemble fibre potential is then given by substituting equation (4.1) into equation (3.5):
 |
4.2 |
which, by commuting the integral and the summation, becomes
 |
4.3 |
In order to investigate whether the suppression of the fibre contribution in compression (i.e. the presence of the Heaviside step) plays a role in the convexity of the ensemble potential, it is also interesting to study the convexity of the ‘comparison’ potential
 |
4.4 |
in which the fibres are allowed to resist compression.
Sufficient condition for the convexity of the ensemble potential (4.3) and the comparison potential (4.4) is the convexity of each (non-dimensional) integral term
| 4.5 |
and
| 4.6 |
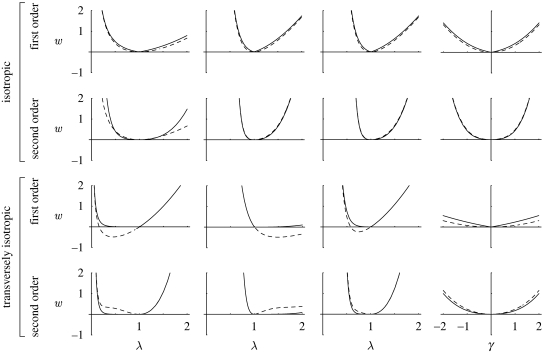
respectively. We tested the convexity of the terms w̄ea(n) and w̄c(n) of orders 1 and 2, and plotted the corresponding graphs with Mathematica 6.0 (Wolfram Research 2008). For the sake of simplicity, the fibre orientation distribution was such that the basis N̂1, N̂2, N̂3 was assumed to be coincident with the canonical basis Ê1, Ê2, Ê3, so that the polar axis was K = N̂1 = Ê1. The tested fibre orientation distributions and deformation states are summarized in table 1. The convexity plots corresponding to the terms of orders 1 and 2 for isotropic (random) and transversely isotropic (peaked at K = N̂1 = Ê1, i.e. Θ = 0) fibre orientation are reported in figure 2. The comparison potential terms of orders 1 and 2 (equation (4.4)), with the fibres allowed to resist compression, are convex with the isotropic fibre distribution, for all deformation states tested, and non-convex with the anisotropic fibre distribution, for most of the deformation states tested. In contrast, the anisotropic ensemble potential terms of orders 1 and 2 (equation (4.3)) with tension-only fibres is convex for all tested combinations of fibre orientation and deformation state. This result suggests that the assumption of fibres having asymmetric behaviour in tension and compression is not only more realistic, but also needed from the point of view of mathematical consistency, in order to achieve convexity.
Table 1.
Fibre orientation distributions ρ and deformation states C̄ tested in the study of the convexity of the first- and second-order terms in the anisotropic ensemble potential with tension-only fibres (w̄ea(n), equation (4.3)) and the comparison potential with tension–compression fibres (w̄c(n), equation (4.4)).
| tested ψ (M) = ρ(Θ): |
isotropic: 
|
transv. isotropic, peak at Θ = 0: 
|
| tested C̄: |
uniaxial stretch in direction Ê1: 
|
biaxial stretch in plane Ê2–Ê3: 
|
biaxial stretch in plane Ê1–Ê3: 
|
simple shear in plane Ê1–Ê2: 
|
Figure 2.
Convexity plots for first- and second-order terms in the anisotropic ensemble potential with tension-only fibres (solid lines; w̄ea(n), equation (4.3)) and the comparison potential with tension–compression fibres (dashed lines; w̄c(n), equation (4.4)). The graphs are arranged in two groups of two rows each. The first group corresponds to an isotropic distribution of fibres (random, i.e. ρ(Θ) = 1/4π), with the first and second row illustrating the first- and second-order terms, respectively. The second group corresponds to a transversely isotropic distribution of fibres (peaked at M = Ê1, i.e. Θ = 0), with the first and second row illustrating the first- and second-order terms, respectively. The first column of graphs refers to uniaxial stretch along Ê1, the second to biaxial stretch in the Ê2–Ê3 plane, the third to biaxial stretch in the Ê1–Ê3 plane, and the fourth to simple shear in the Ê1–Ê2 plane.
5. Finite Element Implementation and Examples
For the finite element implementation of the continuum model based on the ensemble fibre potential, we consider the orientation probability density functions described in §3.4. Note that, because of the generality of the proposed concept, tabulated orientation density functions, e.g. derived directly from experimental studies, could be used instead.
The integration over the unit sphere was performed using a spherical t-design, i.e. a set {M(1), … ,M(N)} ∈ 𝕊2 of N points on the unit sphere, such that, as S(𝕊2) = 4π is the (surface) measure of the unit sphere in ℝ3, the equality
 |
5.1 |
holds for polynomials f of degree k ≤ t (Hardin & Sloane 1996; Hardin et al. 2008). The degree t of the spherical design, used to integrate equations (3.10) and (3.11) up to a required precision, should be determined based on the form of the probability density function ψ (which, in this case, is determined by the concentration parameter b, see equations (3.19)) and the form of the anisotropic fibre potential W̄fa. The model has been implemented into the finite element package FEAP (Taylor 2007) at the Gauss-point level. The underlying scheme is illustrated in table 2. In order to explore the basic mechanisms of the proposed fibre-reinforced model, and to demonstrate its finite element implementation, two numerical examples were analysed: the unconfined compression of a cylindrical articular cartilage specimen and a spherical joint contact problem modelling the hip. Both examples are based on the same material model of articular cartilage, as described in the following.
Table 2.
Finite element implementation of the anisotropic ensemble fibre potential.
| given: |
| isochoric deformation gradient F̄ = J−1/3F |
orientation distribution data 
|
| algorithm: |
| define integration order t b,W̄fa⇒t |
| load spherical design M(α), α ∈ {1 … N} |
initialize stress and elasticity tensors 
|
| DO α = 1, N |
| compute spatial isochoric fibre direction m̄(α) = F̄M(α) |
| compute spatial isochoric structure tensor ā(α) = m̄(α) ⊗ m̄(α) |
| compute fourth invariant Ī4(α) = m̄(α) · m̄(α) = tr(ā(α)) |
| compute co-latitude angle Θ(α) = arccos(K · M(α)) |
| IF (Ī4(α) > 1) THEN |
compute orientation density 
|
| IF (ρ(α) > ε) THEN |
| compute W̄ea contribution of stress and elasticity tensors |

|
| update W̄ea contribution of stress and elasticity tensors |

|

|
| ENDIF |
| ENDIF |
| ENDDO |
5.1. Tested material model for articular cartilage
The arrangement of the collagen fibres was assumed to vary linearly from nearly aligned (Model (B), b = 5) and orthogonal to the tidemark (bone–cartilage interface) in the deep zone of the tissue, randomly oriented in the middle zone (Model (A/B), b = 0), and parallel to the surface in the superficial zone (nearly planar distribution: Model (A), b = 5). Although this reflects the qualitative collagen fibre distribution in articular cartilage (Mollenhauer et al. 2003), detailed quantitative data were not considered in the present computation. Likewise, cartilage was treated as a pure solid (i.e. the fluid phase was neglected) free from residual stresses, and estimates were used for the elastic constants of the matrix and fibres, rather than data from experimental studies. The material was treated as strictly incompressible, so that a function U of the volumetric deformation J (equation (2.4)) need not be defined. The matrix potential and fibre isotropic and anisotropic potentials featuring in equations (3.1)–(3.3) were set as
| 5.2a |
| 5.2b |
| 5.2c |
with constants c0 = 0.1 MPa, cfi = 0.1 MPa and cfa = 5.0 MPa. Note that the matrix potential W̄0 and the fibre isotropic potential W̄fi were assumed to be neo-Hookean, with Ī1(C) = I : C̄ being the first invariant of C̄. The matrix and fibre fractions were set to ϕ0 = 0.8 and ϕf = 0.2, respectively.
The degree t of the spherical design used in the numerical integrations involving the anisotropic fibre potential (5.2c), which is a second-order polynomial in Ī4, has been determined by numerical experiments. In particular, simple tension was considered and t was increased until a converged solution was achieved. This approach defined the empirical relation t = 7.0 + 1.5b for exact integration, where b is the concentration parameter featuring in the normalized von Mises probability density function (3.19). It should be emphasized that (i) anisotropic fibre potentials W̄fa expressed as higher order polynomials in Ī4 require a higher integration order t of the spherical design employed and (ii) for several practical applications, sources of error influence the orientation probability density function, and a lower integration order might be justified.
The computational grids, including the underlying collagen distribution data, were developed in Mathematica 6.0 (Wolfram Research 2008) and the structural analysis was carried out within the multipurpose finite element analysis package FEAP (Taylor 2007). To this end, Q1P0 finite elements (Simo & Taylor 1991) were used and the nonlinear mechanical problem was solved by incrementing the imposed displacements in 10 steps. Incompressible deformation of cartilage tissue was assumed and enforced by an augmented Lagrangian approach, where the Lagrange multipliers were updated by a nested loop at each loading step (Uzawa scheme). The system of linearized equations was solved by an iterative solution scheme with diagonal preconditioning, and all computations were performed on a standard personal computer (Dell Optiplex GX520).
5.2. Cylindrical specimen under unconfined compression
This example aims at investigating the stress state within a cylindrical cartilage specimen of 3.0 mm in diameter and a height of 1.83 mm. Dimensions were taken from test specimens used in Park et al. (2004) and, in accordance with that study, a 0.5 mm thick layer of the deep zone of articular was removed, such that Model (B) with b = 2.85 describes the collagen distribution at the deepest zone of the test specimen. Unconfined compression was assumed and a displacement of 0.366 mm was prescribed at the articular surface corresponding to a physiologically relevant cartilage strain in the direction of the thickness (Park et al. 2004).
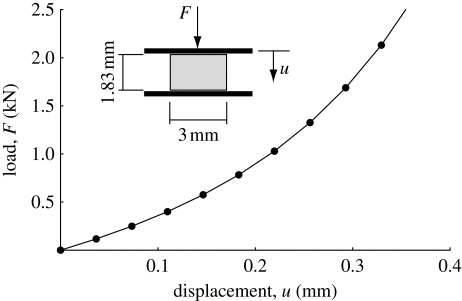
A discretized model involving 21 000 nodes was used and, although the investigated problem is rotationally symmetric, the whole cylindrical specimen was modelled to support possible instabilities of the problem, i.e. not to use too restrictive boundary conditions, which could suppress the development of instabilities. Results demonstrate a significant nonlinear load displacement response with a compressive load of 2.671 N (corresponding to an average engineering stress of 377.9 kPa) at the final displacement of 0.366 mm (figure 3).
Figure 3.
Load–displacement response in the unconfined compression of a cylindrical cartilage specimen, based on the proposed cartilage model.
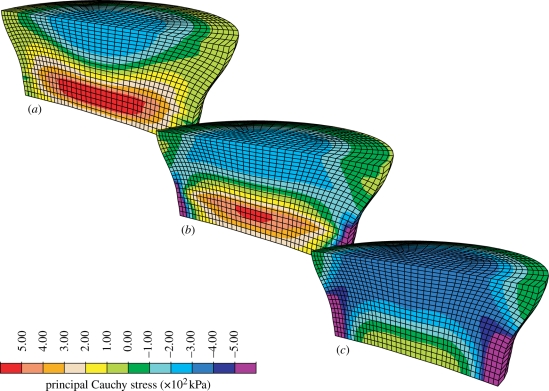
The structural inhomogeneity in the direction of tissue depth (thickness) caused an inhomogeneous deformation, with the prediction of larger radial deformations in the superficial zone compared with those in the deep zone. Likewise, a complex state of stress develops, as shown by the principal stress plots in figure 4.
Figure 4.
Distribution of the (a) first, (b) second and (c) third principal Cauchy stresses in a cylindrical cartilage specimen under unconfined compression. The articular surface is the upper surface, and 0.5 mm of the deep zone was removed.
It is important to note that the original transverse isotropy assumed in the reference configuration is preserved only at all points lying on the axis of symmetry of the cylindrical sample. At these points, indeed, the pushed-forward direction k = FK of the local axis of transverse isotropy of the fibre direction probability density function remains parallel to the reference direction K, which coincides with the axis of symmetry of the sample. At all points lying outside of the axis of symmetry of the sample, the depth-dependent (i.e. varying in the axial direction) stiffness causes a non-uniform radial deformation in the axial direction, which implies that the push-forward k of the reference axis of symmetry K is rotated with respect to its reference direction K. Because of this rotation, fibre buckling occurs in a pattern that is no longer symmetric with respect to k, and local transverse isotropy is lost. Naturally, because of the geometry of the system and the loading, global axial symmetry of the solution is preserved.
5.3. Spherical joint contact
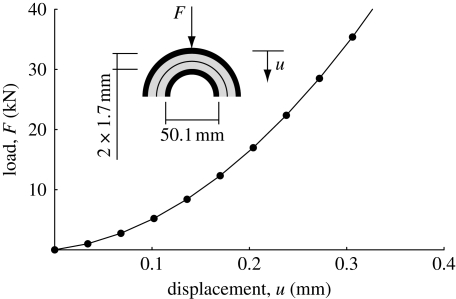
As another example of application, we investigated the hip joint, i.e. the stress distribution in the cartilage between the femoral head and the acetabulum. These were modelled by two hemispherical layers of cartilage (figure 5), each 1.7 mm thick, with the subchondral bone assumed to be rigid, and the femoral head having a diameter of 50.1 mm (Anderson et al. 2008). For simplicity, i.e. to avoid problems inherent to the numerical contact between the two deformable bodies, we considered a rigid interface at the two articular surfaces, which resulted in a small computational effort. The acetabulum was fixed and a displacement was prescribed at the femoral head in the direction of the line connecting the centres of the two hemispheres. A total displacement of 0.34 mm was prescribed, corresponding to a maximal nominal compression of the articular tissue of 10 per cent.
Figure 5.
Load–displacement response of a spherical joint based on the proposed cartilage model.
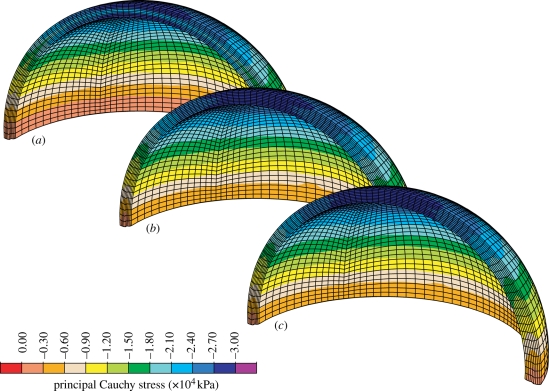
Results show a nonlinear load displacement response of the joint (figure 6) and, although the collagen arrangement varies considerably across the the cartilage thickness, only a moderate stress gradient in that direction was predicted. Here, it is emphasized that complementary computations indicated that an increase in collagen stiffness, i.e. increasing cf, enhances the stress gradient across the thickness. Although the radial strain was kept moderate (10% nominal strain), the incompressibility assumption and the particular kinematics of the joint caused much larger cross-thickness shearing, particularly at the articular surface.
Figure 6.
Distribution of the (a) first, (b) second and (c) third principal Cauchy stresses in a spherical joint.
6. Discussion
Composite materials reinforced by fibres with statistical orientation (described by a probability distribution function) can be modelled by superposing an isotropic elastic potential representing the matrix and an integral term, the ensemble fibre potential, representing the fibres. Because of the presence of the deformation in the integrand function, the resulting potential cannot be directly used analytically (Federico & Herzog 2008c), except for some particular cases. In this work, we developed a robust numerical integration method for the elastic potential, the stress and the elasticity tensor, based on the use of spherical designs (Hardin & Sloane 1996; Hardin et al. 2008). The proposed method is very general, in the sense that any probability distribution density function, representing the fibre orientation in the reference configuration, can be easily implemented into the code, either from an analytical function, or in a tabular form from experimental data.
We also investigated the correctness of the assumption of asymmetric tension–compression fibre behaviour (stiffness in compression lower than in tension), by comparing the convexity plots of an ensemble potential with tension-only fibres, and with tension–compression fibres. For the cases studied, our results show that if fibres are allowed to resist compression to the same extent of tension, the overall elastic potential is non-convex. In contrast, the potential with asymmetric behaviour preserves convexity.
As an example of application, we modelled articular cartilage as anisotropic and inhomogeneous (although monophasic), with a qualitatively realistic location-dependent probability distribution, and simulated the unconfined compression of a cartilage sample, and the cartilage layers of the hip joint.
For the case of articular cartilage, a biological tissue that well represents composites with statistically oriented fibres, several methods have been proposed, all based on finite element models, i.e. often lacking a direct connection with a precise mathematical model. This is the case of the class of mesh superposition methods, in which a ‘base’ mesh is assigned the elastic properties of the matrix, and it is then reinforced by superposing tension-only springs (e.g. Soulhat et al. 1999) or a tension-only congruent mesh (e.g. Li & Herzog 2004). Based on considerations made on the stress, and not on the elastic potential (also because of the assumption of viscoelasticity), Wilson et al. (2004) proposed a model in which only a finite, although very large, number of fibre directions was considered.
Because the proposed method is based on the description of the microstructure, and on the use of averaging integrals rather than on sums over a finite number of fibres, it has two main advantages with respect to the above-mentioned models.
— It enables one to account for the microstructure, while retaining a precise analytical form, represented by the elastic potential, which is directly implemented into finite elements.
— It is not affected by the limitation of a finite number of fibres; furthermore, a large finite number of fibres might require large computational resources, particularly in terms of memory needed to store the information related to the fibre directions used in the computation (in the proposed method, instead, for the case of transverse isotropy, only the mean direction K and the concentration parameter b need to be stored).
On the other hand, the superposition method (Holzapfel et al. 2000), on which the theoretical model of Federico & Herzog (2008c) and the numerical implementation presented here are based, is affected by two limitations.
— It does not account for shear interactions between matrix and fibres; this effect has instead been studied by Guo et al. (2006) in the annulus fibrosus of intervertebral discs (characterized by two distinct families of fibres).
— When fibre orientation has a statistical distribution, it is possible that fibre networking and entanglement occur: such fibre–fibre interaction is not taken into account here.
It should also be noted that a direct, quantitative comparison of the specific applications of the proposed model to articular cartilage with published experimental results is not possible. Indeed, neither the choice of the collagen fibre strain energy potential nor the considered orientation probability density function is based on experimental data.
However, the simulated unconfined compression test (§2) qualitatively reproduces a typical load displacement curve (e.g. fig. 3 in the work by Park et al. (2004)), and the behaviour of the radial displacement as a function of the tissue depth (figure 4), which is larger in the superficial zone (upper surface) and smaller closer to the tidemark (bone–cartilage interface, lower surface), that is commonly found in experiments (e.g. fig. 3 in the work by Fortin et al. (2003)).
The present work provides an efficient and robust numerical implementation of the previously proposed theoretical fibre-reinforced model (Federico & Herzog 2008c), which was shown to be in general not usable in analytical form.
In the future, we plan a more detailed application to the mechanics of articular cartilage, including the use of experimental data for the fibre arrangement (e.g. Mollenhauer et al. 2003), the presence of the fluid phase and the use of microstructural models of permeability (Federico & Herzog 2008a,b) and the effects of growth (Grillo et al. 2009).
Acknowledgements
The authors gratefully acknowledge Dr Raymond W. Ogden for his feedback on the manuscript, Dr Walter Herzog for supporting T.C.G.'s visit at the University of Calgary, and the AIF New Faculty Programme (Alberta Ingenuity Fund, Canada) and the NSERC Discovery Programme (Natural Science and Engineering Research Council of Canada) for partial financial support (S.F.).
References
- Anderson A., Ellis B., Maas S., Peters C., Weiss J. 2008. Validation of finite element predictions of cartilage contact pressure in the human hip joint. J. Biomech. Eng. 130, 051 008 ( 10.1115/1.2953472) [DOI] [PMC free article] [PubMed] [Google Scholar]
- Billiar K. L., Sacks M. S. 2000. Biaxial mechanical properties of the natural and glutaraldehyde treated aortic valve cusp—Part I: experimental results. J. Biomech. Eng. 122, 23–30. ( 10.1115/1.429624) [DOI] [PubMed] [Google Scholar]
- Caner F., Carol I. 2006. Microplane constitutive model and computational framework for blood vessel tissue. J. Biomech. Eng. 128, 419–427. ( 10.1115/1.2187036) [DOI] [PubMed] [Google Scholar]
- Canham P. B., Finlay H. M., Dixon J. G., Boughner D. R., Chen A. 1989. Measurements from light and polarised light microscopy of human coronary arteries fixed at distending pressure. Cardiovasc. Res. 23, 973–982. ( 10.1093/cvr/23.11.973) [DOI] [PubMed] [Google Scholar]
- Curnier A., He Q.-C., Zysset P. 1995. Conewise linear elastic materials. J. Elasticity 37, 1–38. ( 10.1007/BF00043417) [DOI] [Google Scholar]
- Federico S. In press Volumetric-distortional decomposition of deformation and elasticity tensor. Math. Mech. Solids. ( 10.1177/1081286509105591) [DOI] [Google Scholar]
- Federico S., Herzog W. 2008a On the anisotropy and inhomogeneity of permeability in articular cartilage. Biomech. Model. Mechanobiol. 7, 367–378. ( 10.1007/s10237-007-0091-0) [DOI] [PubMed] [Google Scholar]
- Federico S., Herzog W. 2008b On the permeability of fibre-reinforced porous materials. Int. J. Solids Struct. 45, 2160–2172. ( 10.1016/j.ijsolstr.2007.11.014) [DOI] [Google Scholar]
- Federico S., Herzog W. 2008c Towards an analytical model of soft tissues. J. Biomech. 41, 3309–3313. ( 10.1016/j.jbiomech.2008.05.039) [DOI] [PubMed] [Google Scholar]
- Federico S., Grillo A., Herzog W. 2004. A transversely isotropic composite with a statistical distribution of spheroidal inclusions: a geometrical approach to overall properties. J. Mech. Phys. Solids 52, 2309–2327. ( 10.1016/j.jmps.2004.03.010) [DOI] [Google Scholar]
- Flory P. J. 1961. Thermodynamic relations for highly elastic materials. Trans. Faraday Soc. 57, 829–838. ( 10.1039/tf9615700829) [DOI] [Google Scholar]
- Fortin M., Buschmann M. D., Bertrand M. J., Foster F. S., Ophir J. 2003. Dynamic measurement of internal solid displacement in articular cartilage using ultrasound backscatter. J. Biomech. 36, 443–447. ( 10.1016/S0021-9290(02)00413-X) [DOI] [PubMed] [Google Scholar]
- Fung Y. C. 1981. Biomechanics: mechanical properties of living tissue. New York, NY: Springer-Verlag. [Google Scholar]
- Gasser T. C., Holzapfel G. A. 2002. A rate-independent elastoplastic constitutive model for (biological) fiber-reinforced composites at finite strains: continuum basis, algorithmic formulation and finite element implementation. Comput. Mech. 29, 340–360. ( 10.1007/s00466-002-0347-6) [DOI] [Google Scholar]
- Gasser T. C., Ogden R. W., Holzapfel G. A. 2006. Hyperelastic modelling of arterial layers with distributed collagen fibre orientations. J. R. Soc. Interface 3, 15–35. ( 10.1098/rsif.2005.0073) [DOI] [PMC free article] [PubMed] [Google Scholar]
- Grillo A., Federico S., Wittum G., Imatani S., Giaquinta G., Mićunović M. 2009. Evolution of a fibre-reinforced growing mixture. Nuovo Cimento C 32C, 97–119. [Google Scholar]
- Guo Z. Y., Peng X. Q., Moran B. 2006. A composites-based hyperelastic constitutive model for soft tissue with application to the human annulus fibrosus. J. Mech. Phys. Solids 54, 1952–1971. ( 10.1016/j.jmps.2006.02.006) [DOI] [Google Scholar]
- Guo Z. Y., Caner F., Peng X. Q., Moran B. 2008. On constitutive modelling of porous neo-Hookean composites. J. Mech. Phys. Solids 56, 2338–2357. ( 10.1016/j.jmps.2007.12.007) [DOI] [Google Scholar]
- Hardin R. H., Sloane N. J. A. 1996. McLaren's improved snub cube and other new spherical designs in three dimensions. Discrete Comput. Geom. 15, 429–441. ( 10.1007/BF02711518) [DOI] [Google Scholar]
- Hardin R. H., Sloane N. J. A., Smith W. D. 2008. Spherical codes. See http://www.research.att.com/~njas/packings/. [Google Scholar]
- Holzapfel G. A., Gasser T. C. 2001. A viscoelastic model for fiber-reinforced composites at finite strains: continuum basis, computional aspects and applications. Comput. Meth. Appl. Mech. Eng. 190, 4379–4403. ( 10.1016/S0045-7825(00)00323-6) [DOI] [Google Scholar]
- Holzapfel G. A., Gasser T. C., Ogden R. W. 2000. A new constitutive framework for arterial wall mechanics and a comparative study of material models. J. Elasticity 61, 1–48. ( 10.1023/A:1010835316564) [DOI] [Google Scholar]
- Hurschler C., Loitz-Ramage B., Vanderby R., Jr 1997. A structurally based stress-stretch relationship for tendon and ligament. J. Biomech. Eng. 119, 392–399. ( 10.1115/1.2798284) [DOI] [PubMed] [Google Scholar]
- Lanir Y. 1983. Constitutive equations for fibrous connective tissues. J. Biomech. 16, 1–12. ( 10.1016/0021-9290(83)90041-6) [DOI] [PubMed] [Google Scholar]
- Li L., Herzog W. 2004. Strain-rate dependence of cartilage stiffness in unconfined compression: the role of fibril reinforcement versus tissue volume change in fluid pressurization. J. Biomech. 37, 375–382. ( 10.1016/S0021-9290(03)00263-X) [DOI] [PubMed] [Google Scholar]
- Marsden J. E., Hughes T. J. R. 1994. Mathematical foundations of elasticity. New York, NY: Dover. [Google Scholar]
- Menzel A., Harrysson M., Ristinmaa M. 2008. Towards an orientation-distribution-based multi-scale approach for remodelling biological tissues. Comput. Meth. Biomech. Biomed. Eng. 11, 505–524. ( 10.1080/10255840701771776) [DOI] [PubMed] [Google Scholar]
- Miehe C. 1994. Aspects of the formulation and finite element implementation of large strain isotropic elasticity. Int. J. Numer. Meth. Eng. 37, 1981–2004. ( 10.1002/nme.1620371202) [DOI] [Google Scholar]
- Mollenhauer J., Aurich M., Muehleman C., Khelashvilli G., Irving T. C. 2003. X-ray diffraction of the molecular substructure of human articular cartilage. Conn. Tiss. Res. 44, 201–207. ( 10.1080/714040519) [DOI] [PubMed] [Google Scholar]
- Ogden R. W. 1978. Nearly isochoric elastic deformations: application to rubberlike solids. J. Mech. Phys. Solids 26, 37–57. ( 10.1016/0022-5096(78)90012-1) [DOI] [Google Scholar]
- Park S., Hung C. T., Ateshian G. A. 2004. Mechanical response of bovine articular cartilage under dynamic unconfined compression loading at physiological stress levels. Osteoarthr. Cartilage 12, 65–73. ( 10.1016/j.joca.2003.08.005) [DOI] [PubMed] [Google Scholar]
- Quintanilla R., Saccomandi G. 2007. The importance of the compatibility of nonlinear constitutive theories with their linear counterparts. J. Appl. Mech. 74, 455–460. ( 10.1115/1.2338053) [DOI] [Google Scholar]
- Sacks M. S. 2003. Incorporation of experimentally-derived fiber orientation into a structural constitutive model for planar collagenous tissues. J. Biomech. Eng. 125, 280–287. ( 10.1115/1.1544508) [DOI] [PubMed] [Google Scholar]
- Sansour C. 2008. On the physical assumptions underlying the volumetric-isochoric split and the case of anisotropy. Eur. J. Mech. A/Solids 27, 28–39. ( 10.1016/j.euromechsol.2007.04.001) [DOI] [Google Scholar]
- Simo J. C., Taylor R. L. 1991. Quasi-incompressible finite elasticity in principal stretches. Continuum basis and numerical algorithms. Comput. Meth. Appl. Mech. Eng. 85, 273–310. ( 10.1016/0045-7825(91)90100-K) [DOI] [Google Scholar]
- Simo J. C., Taylor R. L., Pister K. S. 1985. Variational and projection methods for the volume constraint in finite deformation elasto-plasticity. Comput. Meth. Appl. Mech. Eng. 51, 177–208. ( 10.1016/0045-7825(85)90033-7) [DOI] [Google Scholar]
- Soulhat J., Buschmann M. D., Shirazi-Adl A. 1999. A fibril-network-reinforced biphasic model of cartilage in unconfined compression. J. Biomech. Eng. 121, 340–347. ( 10.1115/1.2798330) [DOI] [PubMed] [Google Scholar]
- Taylor R. L. 2007. FEAP—a finite element analysis program, version 8.2 user manual. Berkeley, CA: University of California at Berkeley. [Google Scholar]
- Walpole L. J. 1981. Elastic behavior of composite materials: theoretical foundations. Adv. Appl. Mech. 21, 169–242. ( 10.1016/S0065-2156(08)70332-6) [DOI] [Google Scholar]
- Weiss J. A. 1994. A constitutive model and finite element representation for transversely isotropic soft tissues. Dissertation, Department of Bioengineering, University of Utah, USA. [Google Scholar]
- Weiss J. A., Gardiner J. C. 2001. Computational modeling of ligament mechanics. Crit. Rev. Biomed. Eng. 29, 303–371. [DOI] [PubMed] [Google Scholar]
- Weiss J. A., Maker B. N., Govindjee S. 1996. Finite element implementation of incompressible, transversely isotropic hyperelasticity. Comput. Meth. Appl. Mech. Eng. 135, 107–128. ( 10.1016/0045-7825(96)01035-3) [DOI] [Google Scholar]
- Weisstein E. W. 2005. Erfi. From MathWorld—A Wolfram Web Resource. See http://mathworld.wolfram.com/Erfi.html. [Google Scholar]
- White A. A., Panjabi M. M. 1978. Clinical biomechanics of the spine. Philadelphia, PA: Lippincott. [Google Scholar]
- Wilson W., van Donkelaar C. C., van Rietbergen B., Ito K., Huiskes R. 2004. Stresses in the local collagen network of articular cartilage: a poroviscoelastic fibril-reinforced finite element study. J. Biomech. 37, 357–366. ( 10.1016/S0021-9290(03)00267-7) [DOI] [PubMed] [Google Scholar]
- Wolfram Research 2008. Mathematica 6.0—documentation. Champaign, IL: Wolfram Research, Inc. [Google Scholar]


