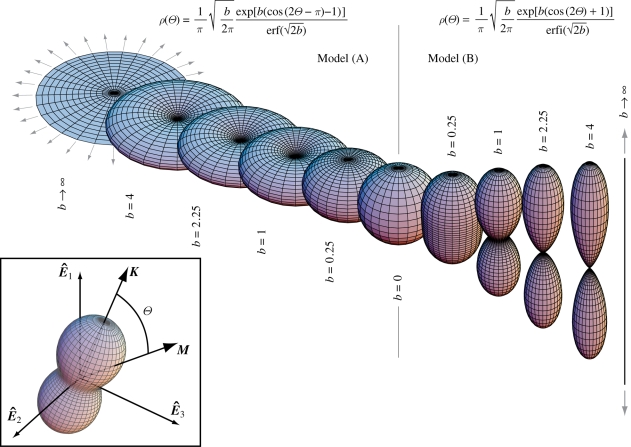
Figure 1.
Transversely isotropic probability distribution density functions describing fibre orientation, mapping points M on the unit sphere into the real numbers. Surface plots are defined by the vector ρ(Θ)M and ρ is based on the von Mises distribution. The limit case of b = 0 describes isotropy, and the limit case of b → ∞ describes planar isotropy for ‘Model (A)’ defined by equation (3.19a) and fibres all aligned in the polar direction for ‘Model (B)’ defined by equation (3.19b). The box in the left-bottom corner describes the general case in which the polar direction K does not coincide with any of the axes of the canonical basis {Ê1, Ê2, Ê3}.

