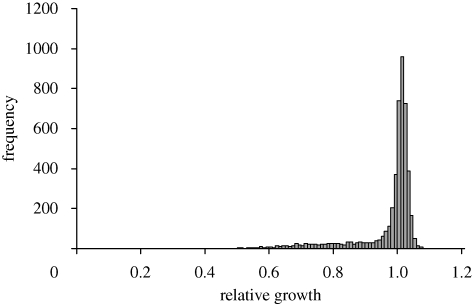
Figure 3.
Distribution of selection coefficients among deletion strains in complete (YPD) medium. Each estimate is 1 + b, where b is the regression of log hybridization intensity on time (in generations) for three time points during the first 20 generations of growth. Data from Steinmetz et al. (2002); available at http://www-deletion.stanford.edu/YDPM/YDPM_index.html.

