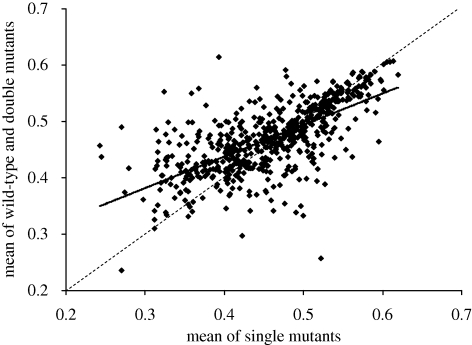
Figure 5.
Epistasis in crosses between deletion strains with low growth rates. Each point is the mean of two to four replicate estimates per cross: data from Jasnos & Korona (2007). The regression slope is +0.5595 + s.d. 0.0239. The dashed line is the line of equality. The unweighed mean growth of the single deletant segregants is 0.458 (s.d. = 0.073), and the mean of the nil-deletion and double-deletion segregants is 0.470 (s.d. = 0.060).

