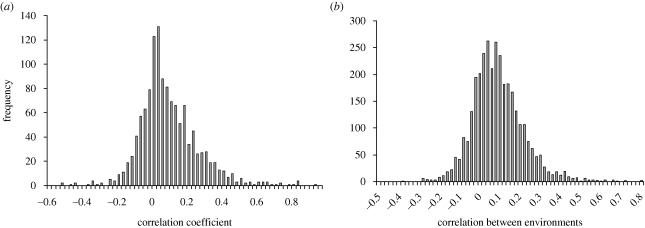
Figure 6.
Distribution of genetic correlation over environments for the deletion strains. (a) Data for 1275 single-gene deletion strains grown in 51 growth conditions involving cytotoxic or cytostatic agents from Brown et al. (2006, electronic supplementary material). Mean = 0.0979; s.d. = 0.1697; s.e. = 0.0048; 950/1275 = 74.5% estimates were positive. (b) Data for 4111 single-gene deletion strains grown with 82 compounds and natural extracts from Parsons et al. (2006, electronic supplementary material, table S7). Mean = 0.0997; s.d. = 0.1266; s.e. = 0.0022; 2674/3321 = 80.5% of estimates were positive.

