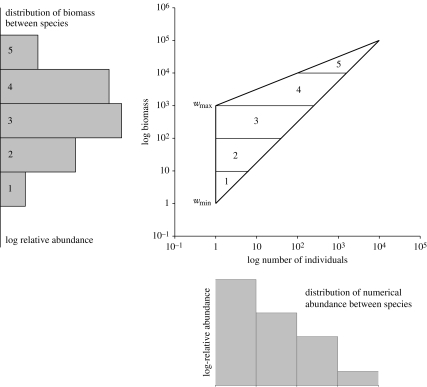
Figure 1.
The derivation of the shape of the SAD in terms of biomass and number based on the assumption that the distribution of species within natural communities are scattered at random or are regularly distributed within a triangular region. In this example, we assume an obtuse triangle, which is probably the commonest pattern in well-sampled communities. wmin is the minimum biomass of a single individual retained by the sampling method. wmax is the weight of the largest singleton species within the area of study. The figure shows how the shape of the SAD can be predicted. The areas within the triangle marked 1–5 give the relative frequency of species within each log biomass size class and are plotted as a histogram to the left. The same analysis can be undertaken perpendicular to the x-axis to predict the SAD using numerical abundance.

