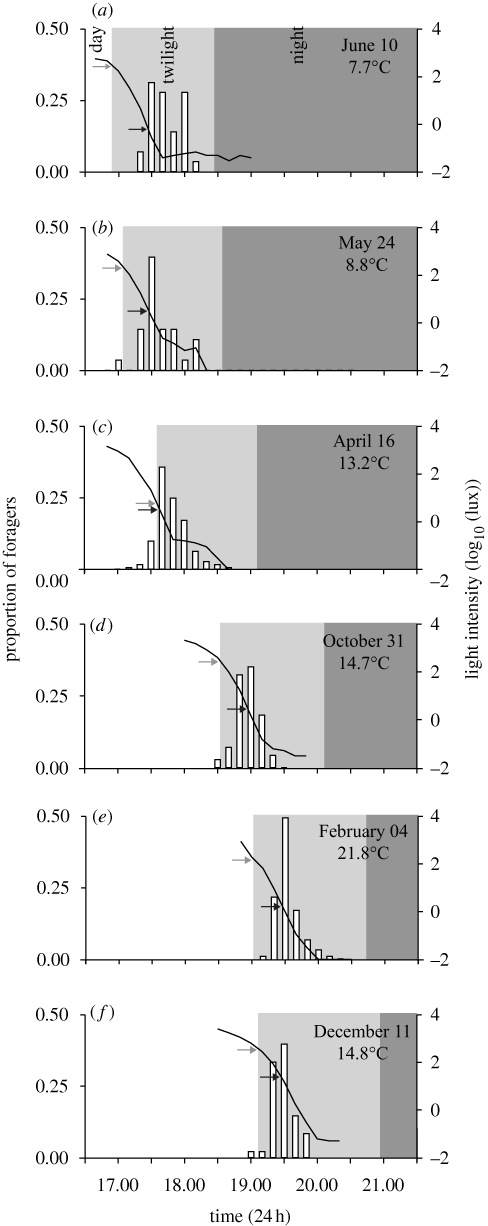
Figure 2.
Foraging bouts of M. pyriformis recorded from six nests at different times of the year. Sunset time corresponds to the start of twilight. Light intensity (black line), recorded in 10 min bins, is shown on the secondary y-axis. Grey arrows highlight light intensity at the time of sunset and black arrows indicate light intensity at the time of foraging onset. Foraging onset is defined as the time at which the maximum number of foragers left the nest. Sampling date and temperature at foraging onset are shown in each panel. Panels (a–f) are ordered according to increasing sunset time. (c) Nest was recorded on a mildly cloudy day, hence the lower light intensities at sunset time compared with the other days.

