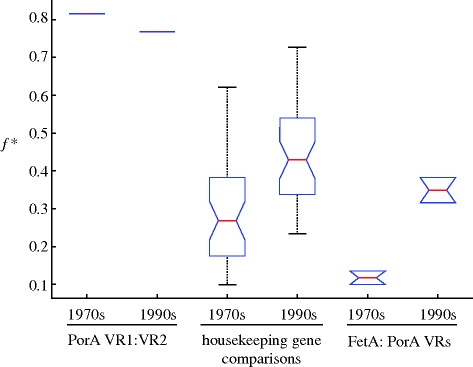
Figure 2.
The distribution of f* scores from the data split into the 1970s (1971–1983) and the 1990s (1992–1997). The number of calculations for each type of two-locus comparison was the same as for the D* scores. The housekeeping gene comparisons represent all three types of comparison: housekeeping gene versus housekeeping gene or PorA VRs or FetA scores (these three groups are not significantly different from each other, as expected).

