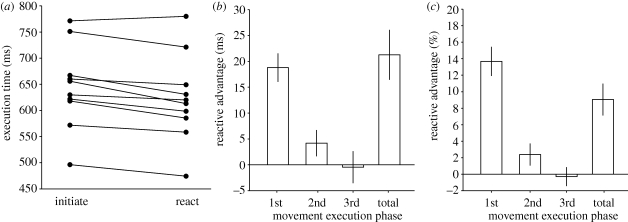
Figure 2.
(a) Average movement execution times for each individual participant. Data show the harmonic mean execution time. Points connected by lines indicate the data from a single individual. Our data analysis considered the difference between these matched-pair responses. (b) The ‘reactive advantage’ (=initiated movement execution time−reactive movement execution time) for the three component phases of the movement sequence (1st: lift up from button 1, press down button 2; 2nd: lift up button 2, press down button 3; 3rd: lift up button 3, press down button 1), and for the total execution time (lifting up button 1 to pressing it down again having pressed button 2 and then 3). Data illustrate the between-subjects mean response. Error bars show s.e.m. (c) The reactive advantage expressed as a percentage change in the mean execution time. Data illustrate the between-subjects mean response with error bars showing s.e.m.

