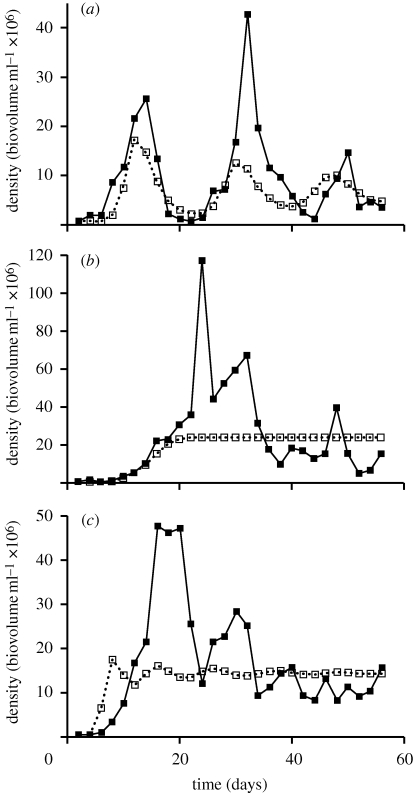
Figure 3.
Sample population dynamics of B. calyciflorus for each experimental treatment. Presented are population dynamics (solid line) and model dynamics (dotted line) for each of the three treatments: (a) the strong consumer–resource interaction; (b) the weak consumer–resource interaction and (c) the weak and strong consumer–resource interaction.

