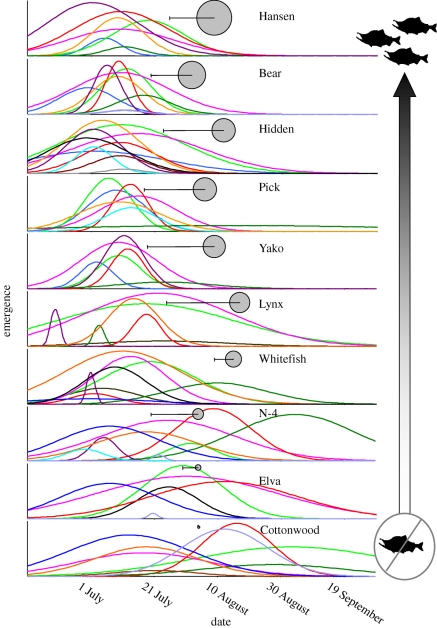
Figure 1.
Seasonal patterns of aquatic insect emergence in 10 streams spanning a gradient in salmon density. Streams are ordered from top to bottom by descending spawning salmon densities. Each curve represents the estimated emergence timing of an insect taxon. Curves were normalized such that the height of each curve was relative to the rank abundance of the taxa for each stream. Different coloured curves represent different taxa (Plecopterans: bright green = Chloroperlidae, dark green = Zapada spp., aqua blue = Isoperla spp.; Dipterans: pink = Chironomidae, Trichopterans: orange = all Trichopterans; Ephemeropterans: black = Ephemerella inermis, royal blue = Baetis bicaudatus, red = Cinygmula spp., purple = Drunella doddsi, brown = Acentrella turbidae, grey = Ameletus spp., lavender = Epeorus grandis; see electronic supplementary material, table S1). Grey circles represent timing and magnitude of spawning sockeye salmon. The diameter of the circle is proportional to the average density of spawning salmon, and the centre of the circle is the median date of peak salmon density. The left error bar portrays the median date of entry of spawning salmon.

