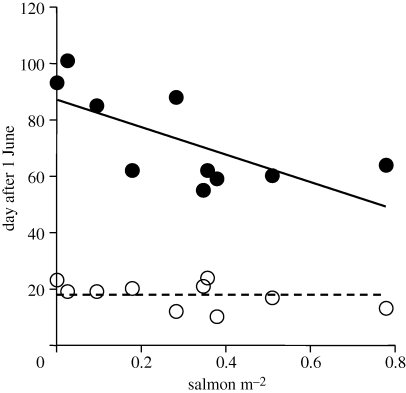
Figure 2.
Relationship between salmon density and timing of total insect emergence. Open circles represent the date at which 5 per cent of the insect biomass had emerged and closed circles indicate the date when 95 per cent of insect biomass had emerged. The solid line shows the significant negative relationship between stream salmon density and date of 95 per cent emergence. The dashed line indicates the average date of 5 per cent emergence, as this slope was not significant.

