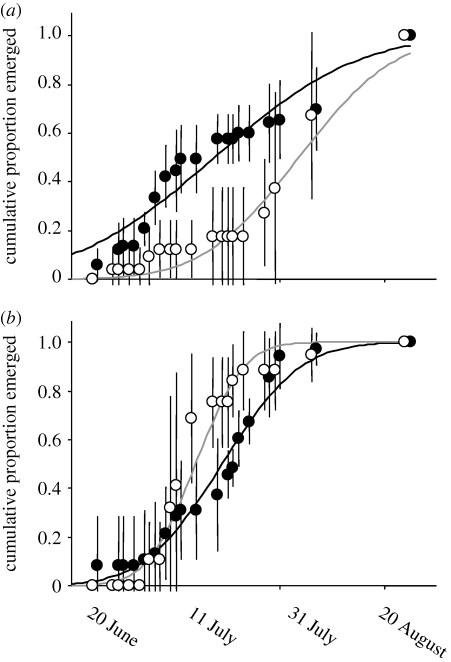
Figure 4.
Emergence timing from the common rearing experiment. Shown are the cumulative proportion emerged of (a) Cinygmula spp. and (b) chloroperlidae, averaged across replicates, ±1 s.d. The curves represent the best-fit cumulative normal distributions. Open circles, N-4 (low salmon); closed circles, Hansen (high salmon).

